Supply chain analytics transform raw ERP data into insights that help planning teams reduce stock-outs, minimize excess inventory to release working capital, and make faster decisions. Most businesses already have the data, but may lack the know-how to turn it into action. We’re here to change that by giving planners the knowledge they need.
This article covers the core types of supply chain analytics, how they apply to inventory performance, and what to look for when evaluating solutions. By the end, you’ll have the information you need to turn data into decisions and optimize your processes.
Key takeaways
- Supply chain analytics collects and analyzes data from sourcing, manufacturing, inventory, and logistics to guide decisions about how goods move from suppliers to customers.
- Five core types of analytics exist: descriptive (what happened), diagnostic (why it happened), predictive (what will happen), and prescriptive (what to do about it).
- Analytics transforms ERP data into actionable insights that help reduce stock-outs, minimize excess inventory, and free up cash.
- AI-powered analytics surfaces opportunities and risks that manual analysis typically misses.
- The value of analytics depends on data quality, system integration, and whether insights translate into timely decisions.
What is supply chain analytics?
Supply chain analytics is the practice of collecting, integrating, and examining data from sourcing, manufacturing, inventory, and logistics. The goal is to help businesses make better decisions about how goods move from suppliers to customers, lower costs, and avoid delays.
Your ERP system captures transactions. Analytics tells you what those transactions mean and what to do next.
With an ERP in place, the data is already available. The next step businesses must take is leveraging that data as a decision-making tool. And they need to be able to do this fast: when demand shifts, suppliers miss commitments, or inventory gets out of balance. Analytics makes this possible in a way that manual spreadsheets simply can’t. It identifies patterns easily missed by human review, automatically flags risks, and recommends specific actions.
Why supply chain analytics matter for inventory performance
Without analytics, planning teams rarely have the insights they need to address challenges proactively. They’re left reacting to problems after they’ve already affected the business. A stock-out shows up in a customer complaint. Excess inventory appears on a quarterly balance sheet. By then, the damage is done.
Analytics shifts the focus from reaction to anticipation. When you can see which SKUs are trending toward a stock-out two weeks before it happens, you can adjust. When you can identify slow-moving inventory before it ties up working capital for another quarter, you can act.
When inventory is the largest asset on the balance sheet, analytics directly affects profitability.
- Fewer stock-outs: Catching at-risk items early protects revenue and customer relationships.
- Lower carrying costs: Identifying excess inventory releases working capital.
- Better service levels: Aligning inventory with actual demand patterns improves fill rates.
5 Types of supply chain data analytics
The types of supply chain analytics can be organized in subcategories based on the question each answers. Each type works with the others, delivering data insights that move planners from understanding what happened to recommending what to do next.
| Analytics type | What it does | Question answered | Example use case |
| Descriptive | Summarizes historical performance | What happened? | Reviewing last quarter’s inventory turnover |
| Diagnostic | Examines root causes | Why did it happen? | Identifying why stock-outs spiked in a region |
| Predictive | Uses historical patterns to forecast future outcomes | What will happen? | Forecasting demand for upcoming season |
| Prescriptive | Recommends specific actions based on predicted outcomes | What should we do? | Recommending optimal reorder quantities |
| Cognitive | Uses AI and machine learning to identify patterns and surface insights automatically | What are we missing? | Surfacing hidden optimization opportunities |
1. Descriptive analytics
You might use descriptive analytics to review last quarter’s inventory turnover ratio, track monthly sales trends by product category, or measure average supplier lead times over the past year. Most ERP reporting falls into this category. Descriptive analytics is useful for establishing baselines and spotting trends, but it doesn’t explain why something happened or what to do about it.
2. Diagnostic analytics
When descriptive analytics shows that stock-outs spiked in a particular region, diagnostic analytics helps you understand whether the cause was a demand surge, a supplier delay, the impact of tariffs, or a forecasting error. It looks at correlations and patterns across multiple data sources to isolate contributing factors.
3. Predictive analytics
By analyzing past sales data, seasonality, lead time variability, and external factors, predictive analytics can estimate future demand, anticipate potential stock-outs, or flag suppliers likely to miss delivery windows. The goal is to give planning teams advance warning so they can adjust before problems materialize.
4. Prescriptive analytics
Rather than simply forecasting that a SKU will run low in three weeks, prescriptive analytics might recommend a specific reorder quantity, suggest an alternative supplier, or propose redistributing excess inventory from another location. The value here is speed. Instead of analyzing data and then deciding what to do, the recommendation comes with the insight.
5. Cognitive analytics
Traditional analytics requires someone to ask the right question. Cognitive analytics, a subset of some types of AI, can surface issues and opportunities that humans might not think to look for. It continuously monitors data across the supply chain and flags anomalies, risks, or optimization opportunities without waiting for a query. In a supply chain context, this type of AI delivers significant ROI.
How supply chain data management supports analytics: Steps to take
Good analytics are fueled by good data. Fragmented, inconsistent, or outdated data, on the other hand, limits what analysis can deliver. Following data audit and hygiene best practices helps ensure your analytics can deliver accurate insights and recommendations. From there, you’re able to act confidently.
1. Collect and integrate data
Data flows from multiple sources: ERP systems, supplier portals, sales channels, warehouse management systems. For analytics to work, this data comes together in a unified view. A modern supply chain analytics solution, like Netstock, integrates with existing systems rather than replacing them. It pulls data automatically on a regular schedule. Layered on top of your data sources, Netstock provides a consolidated view of your data and unifies sources for comprehensive analysis.
2. Prepare and clean data
Raw data rarely arrives analysis-ready. Duplicate records, inconsistent naming conventions, missing fields, and outdated entries all create additional noise that slows decision-making speed. Data preparation involves standardizing formats, removing duplicates, and validating accuracy. Without this step, insights become unreliable.
3. Analyze and model data
Once data is prepared, algorithms and statistical models identify patterns, detect anomalies, and generate demand and inventory forecasts. Simple approaches might calculate moving averages. More advanced forecasting methods use machine learning to weight multiple variables and improve accuracy over time.
4. Visualize and act on insights
Dashboards and reports translate analysis into formats that planning teams can interpret quickly. The goal isn’t just visualization, though. It’s action. The most useful analytics tools don’t just show charts; they highlight what requires attention and recommend specific next steps.
See what this looks like in practice:
Supply chain analytics examples across business functions
Analytics applies differently depending on the operational area. Here’s how it works in four different places.
Inventory optimization
Inventory analytics can identify which SKUs carry excess stock and which risk running out. By analyzing demand patterns, lead times, and service level targets, it can recommend safety stock levels that balance availability against carrying costs.
What does this look like? Well, a distributor might discover that 15% of their SKUs account for most of their excess inventory value. Analytics surfaces this insight and helps prioritize which items to address first.
Demand forecasting
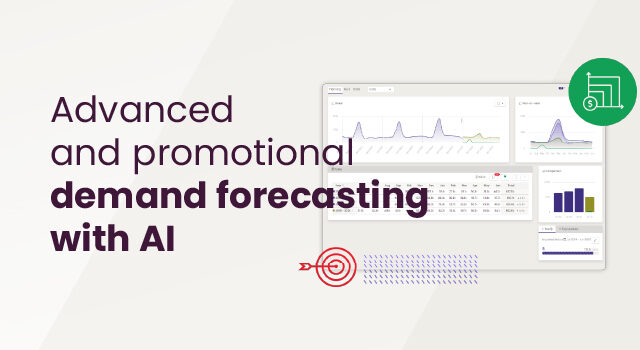
Accurate forecasts reduce both stock-outs and excess inventory. Analytics improves forecast accuracy by incorporating historical sales, seasonality, promotional effects, and external factors.
The connection between forecasting and inventory is direct: Better forecast accuracy translates to reduced safety stock requirements and fewer surprises.
Supplier performance
Analytics tracks on-time delivery rates, lead time variability, quality metrics, and order accuracy across suppliers. This visibility helps identify which suppliers pose the greatest risk to inventory availability. When a supplier’s on-time delivery rate drops over several months, supplier performance analytics flags the trend before it causes a stock-out.
Risk identification
Supply chain disruptions usually arrive with warning signals. These signals are what advanced supply chain analytics solutions watch for. They continuously monitor for demand volatility, supply constraints, and inventory imbalances that could affect operations.
Proactive alerts give planning teams time to respond. A sudden spike in demand for a product category, a supplier facing capacity constraints, or a warehouse running low on a critical component can all be flagged before they become emergencies.
Benefits of supply chain analytics
The value of analytics shows up in operational metrics and financial outcomes.
Reduced risk
Analytics helps evaluate trade-offs and analyze scenarios, so planners can make the best choice even in volatile conditions.
Beco, a wholesale distributor that reduced inventory holding by 10-15% in the first year, highlighted this as one of the primary benefits of adopting Netstock as its supply chain analytics solution. “[Netstock] gives us the chance as a team to review potential issues early enough to speak to suppliers and either slow something down or speed something up,” said Omar Ibrahim, Head of Operations at Beco.
Faster decisions
Automated analysis replaces hours of manual spreadsheet work with immediate recommendations.
For businesses like National Beauty Distribution, the difference is upwards of 4 hours saved per order. Time savings like these quickly add up, delivering other benefits like reduced labor needs. With the efficiencies Netstock provides, National Beauty Distribution has been able to expand without increasing headcount.
Improved forecast accuracy
Data-driven predictions minimize the discrepancy between expected and actual demand.
With these analytics, businesses can reduce excess inventory by 50% without slowing growth, just as Redmond Life did. A year after implementation, Inventory Manager Bronson Nemelka was able to look back at the difference it made in their daily operations and report that: “Netstock turned an unmanageable process into a structured, scalable one. I couldn’t imagine trying to do this with spreadsheets today; it would take more than one full-time person.”
Greater visibility
Dashboards consolidate fragmented data into a single view of supply and demand across all locations.
For David Pimental, Procurement Buyer at Distributor Wire and Cable, who has these advanced analytics at his fingertips, his workday now looks like this: “I check the dashboard to see how everything looks across our locations…the system highlights excess or dead stock in one location and suggests where it could be used. That lets me quickly transfer that stock instead of placing new orders.”
And as any business leveraging supply chain analytics solutions will tell you, the financial impact compounds over time. Reducing excess inventory by even a few percentage points can free up working capital. Preventing stock-outs protects revenue that would otherwise be lost.
“It’s early days, and we have already seen an exceptional return on our investment.
Key KPI Improvements (within 4 months):
- 20% reduction in stock holding
- 10% reduction in excess stock
- 22% improvement in stock turns
- 50% reduction in stock-outs” – Jared Ramkellowan, IT and Operations Manager at CC1 St. Maarten
Common challenges when implementing supply chain analytics
While the ROI can be rapid, adoption isn’t always frictionless. Understanding common obstacles businesses face when implementing analytics solutions helps set realistic expectations for your team.
| Challenge | How it presents |
| Data silos | Information trapped in disconnected systems limits the scope of analysis. |
| Data quality issues | Incomplete or inaccurate data undermines the reliability of insights. |
| Adoption resistance | Teams accustomed to spreadsheets may be slow to trust automated recommendations. |
| Integration complexity | Connecting analytics tools with existing ERP systems requires planning. |
How AI is changing supply chain analytics
AI moves analytics from passive reporting to active recommendation. Traditional analytics requires someone to run a report, interpret the results, and decide what to do. AI-powered analytics can surface the critical items most teams miss, turning complex data into clear next steps.
Models improve over time as they process more data. They can identify patterns across thousands of SKUs that would be impossible to spot manually. And they can generate recommendations continuously, not just when someone remembers to check.
For planning teams managing large inventory catalogs, AI handles the heavy lifting of data analysis so humans can focus on decisions and exceptions. Netstock’s AI Pack, for example, interprets data and recommends actions with a single click, helping teams identify reorder opportunities based on stock levels, demand forecasts, and lead times.
Choosing supply chain analytics solutions
When evaluating analytics solutions, focus on what matters for your specific situation. The right solution depends on your inventory complexity, ERP environment, and team capabilities. Consider:
- ERP integration: The solution connects with your existing systems without extensive customization.
- Time to value: Some platforms deliver results in weeks, not months.
- Actionable outputs: Prioritize tools that recommend specific actions over those that only display data.
- Ease of use: Planners and executives can interpret insights without specialized training.
- Security: Confirm data protection standards meet your organization’s requirements.
Turning supply chain analytics into action
The most sophisticated analysis is worthless if it sits in a report no one reads or arrives too late to act on. The best supply chain analytics solutions translate complex data into clear recommendations teams can act on immediately. They surface what’s changing, identify what’s at risk, and suggest what to do next. In businesses where inventory represents a major investment, this capability directly affects cash flow, service levels, and profitability.