For inventory planning managers of small- to medium-sized businesses, giving CFOs, ops VPs, and business owners clear visibility into inventory health is often an uphill battle. Traditional BI tools and custom ERP reporting modules can fall into a “blank-canvas trap.” They need developer time, complex queries, and ongoing IT support just to build basic operational views. Even then, executives usually get static charts that show what happened but not why or what to do about it.
Netstock’s reporting and dashboards avoid that trap. They’re built on more than 15 years of experience in inventory and demand planning, informed by insights from 2,500 customers across 60 countries. The result is purpose-built, industry-tested views that show planners what good looks like. Planners can customize reports for stakeholders without IT support, connecting daily inventory decisions to the financial conversations happening in the C-suite.
This article covers Netstock’s purpose-built dashboards, how to build a custom report, and how to export reports for board and stakeholder presentations.
Key takeaways
- Instant visibility from day one: The Netstock Dashboard, Executive Dashboard, and AI Opportunities give planners and executives a clear view of inventory health with no setup required.
- Self-service custom reporting: With Report Builder, planners build unlimited custom reports, choosing the fields, filters, and sort order they need. Reports can be scheduled to refresh daily with fresh data, without IT involvement. Netstock data can also connect directly to Power BI, Tableau, or Looker Studio.
- Board-ready outputs: The Dashboard Analyzer writes executive summaries from the Executive Dashboard. Stock Projection models inventory value, fill rate, and future orders 12 months ahead, or 24 months with the Extended Planning Horizon.
- What good looks like, built in: Netstock reporting starts from proven inventory planning KPIs such as fill rate, stock turns, excess, and stock-outs. Teams get context and clear next steps instead of a blank canvas.
How Netstock reporting is structured
Netstock separates reporting into two layers that work together:
- Dashboards are action-oriented. They update daily and show what needs attention today.
- Reports are analytical. They explain why performance looks the way it does and how it has changed over time.
Dashboards help teams act. Reports help them learn and improve.
The Netstock Dashboard, Executive Dashboard, AI Opportunities, and classification matrix are included in every Netstock product bundle. Report Builder, Stock Projection, the Extended Planning Horizon, and the AI Pack (including the Dashboard Analyzer, Item Analyzer, and Report Explainer) are part of the Advanced bundles.
1. Purpose-built dashboards: from daily exceptions to executive summaries
“Netstock’s dashboards come pre-configured and are ready to use from the first day of data import, with no setup or configuration required. Each one is designed around the questions planners and executives ask most, so teams never have to build metrics from scratch.
The Netstock Dashboard: instant visibility into inventory health. The Dashboard is where planners start every day, and it sits at the heart of Netstock. It’s pre-configured to show the KPIs that matter most for the business: stock holding, excess stock, surplus orders, fill rate, stock-outs, and potential stock-outs, each with a trend line showing whether performance is improving. Netstock assigns every item a daily status, and each KPI panel lists the top five SKUs driving it, ranked by value and shown with their classification. Planners work from a focused list of exceptions instead of scanning thousands of SKUs, so they can see which issues need urgent attention and act where it makes the biggest business impact. Fill Rate Impact shows which stock-outs are costing the most in customer service.
The Netstock dashboard is hands down my favorite feature. It allows my team to quickly prioritize their day. I always say to the team, focus on the top 5 and leave the rest for tomorrow! With the dashboard, we quickly pinpoint the most crucial action to take- T2, Australia
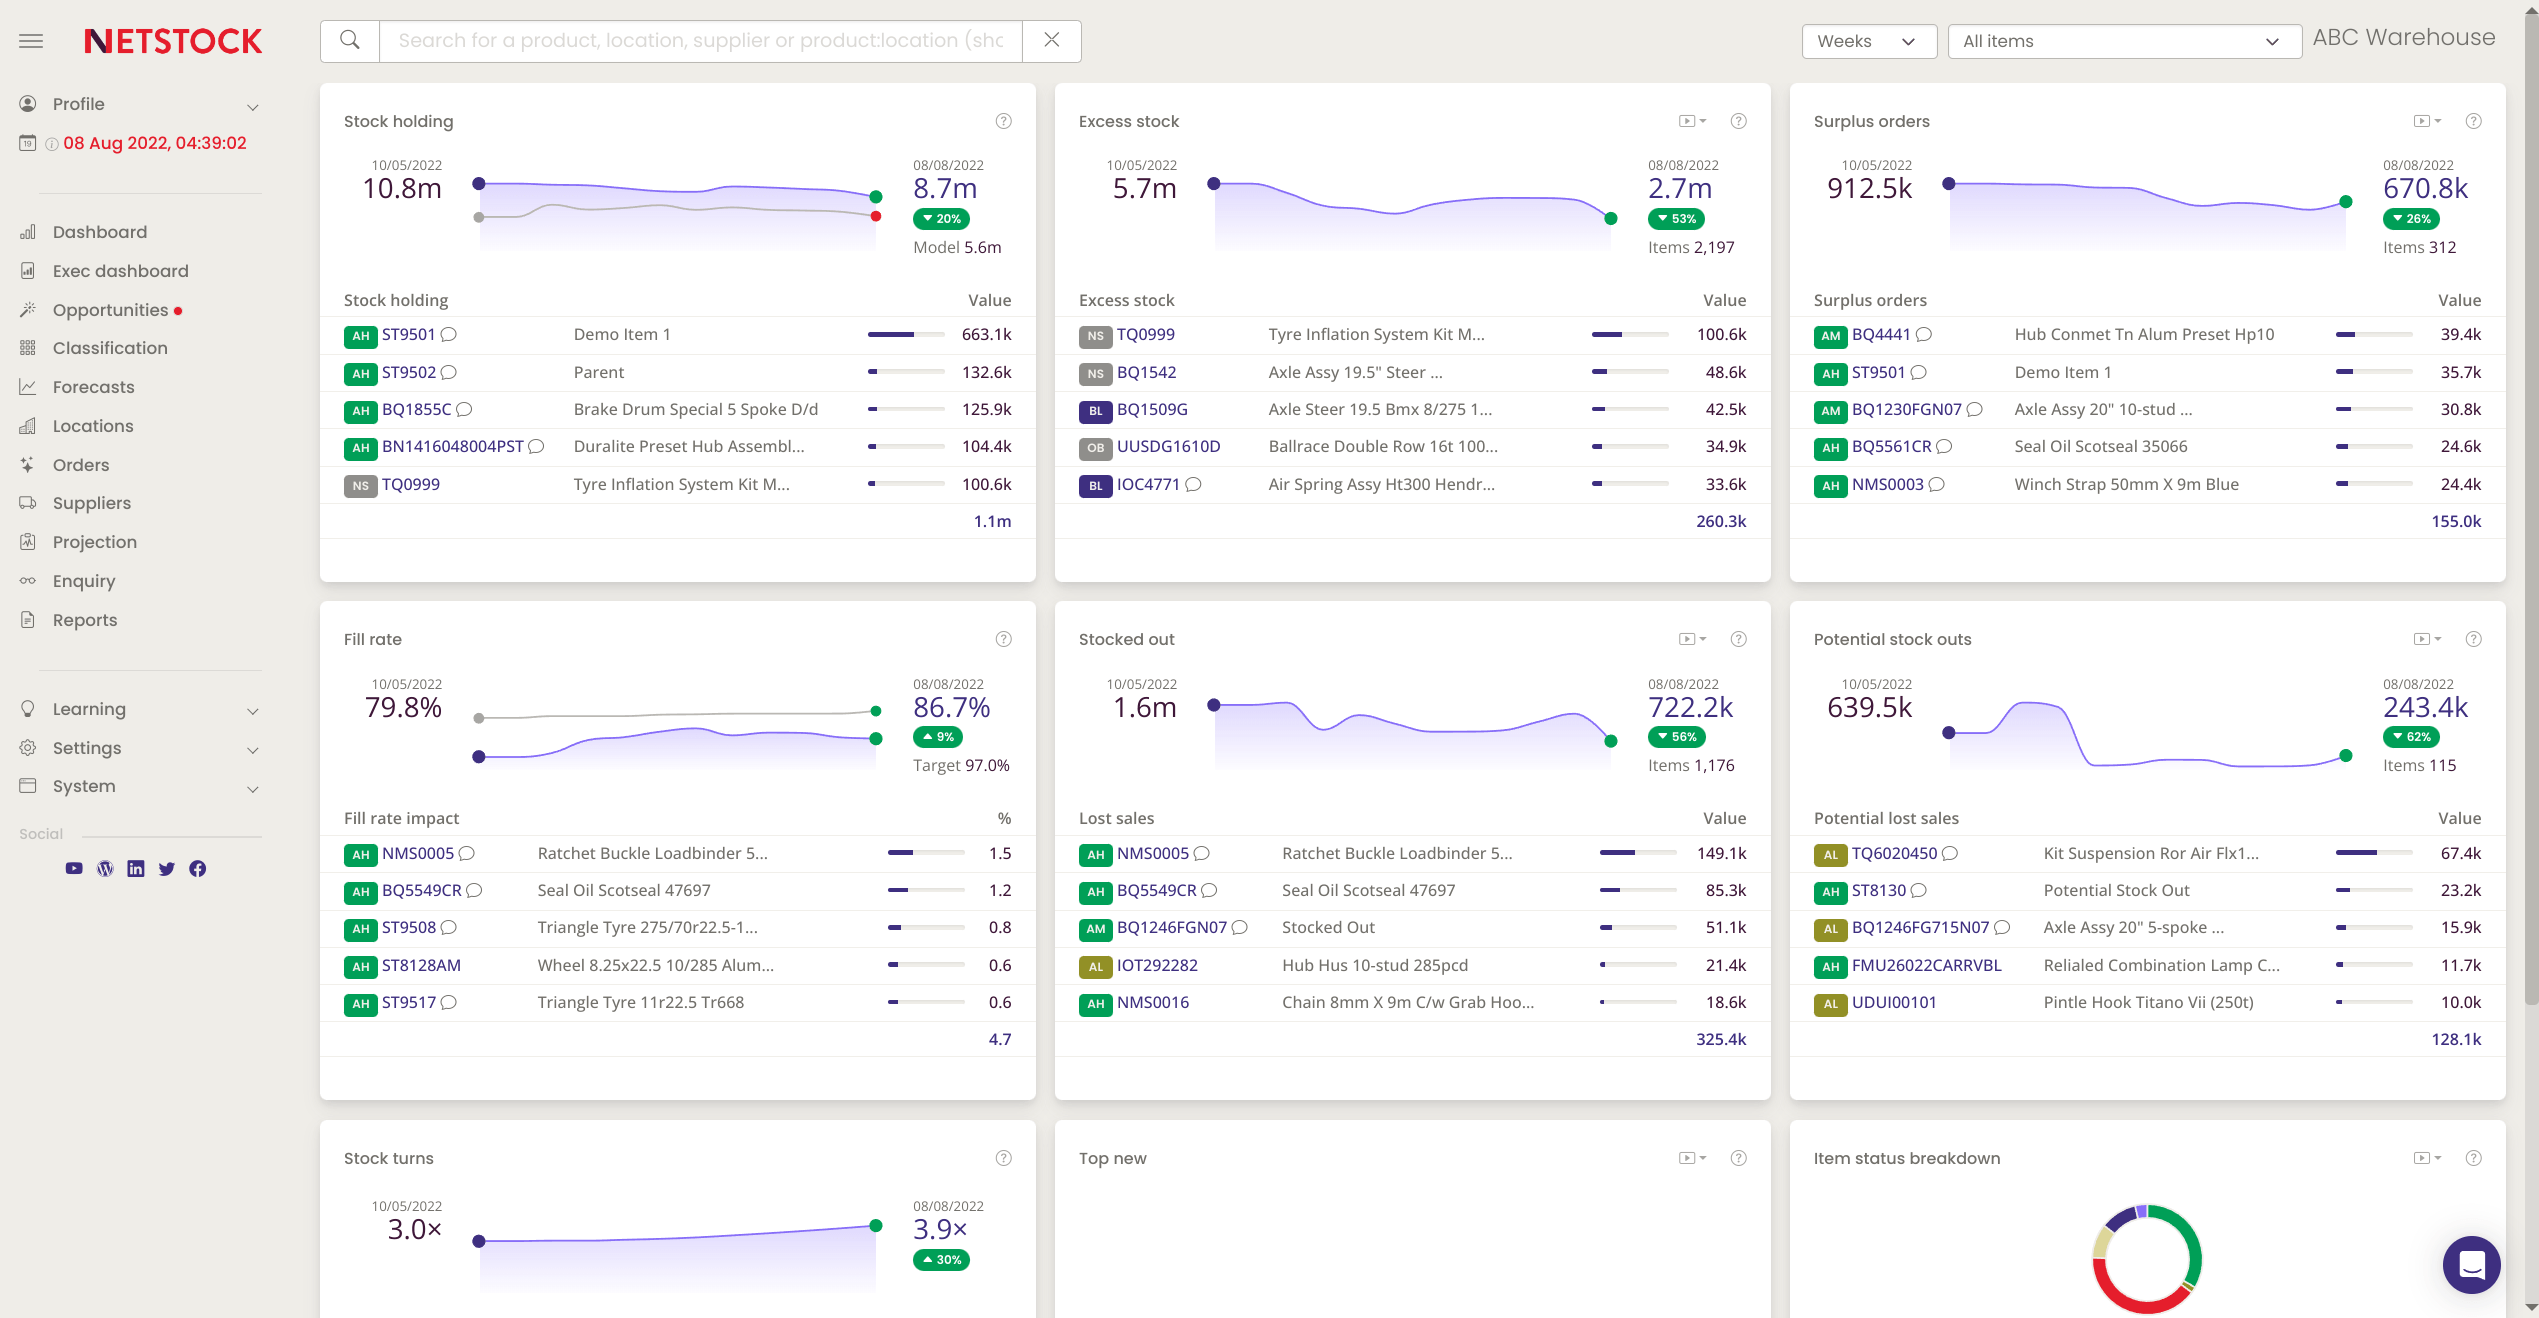
The Netstock Dashboard monitors core inventory KPIs daily, so planners see where to act first.
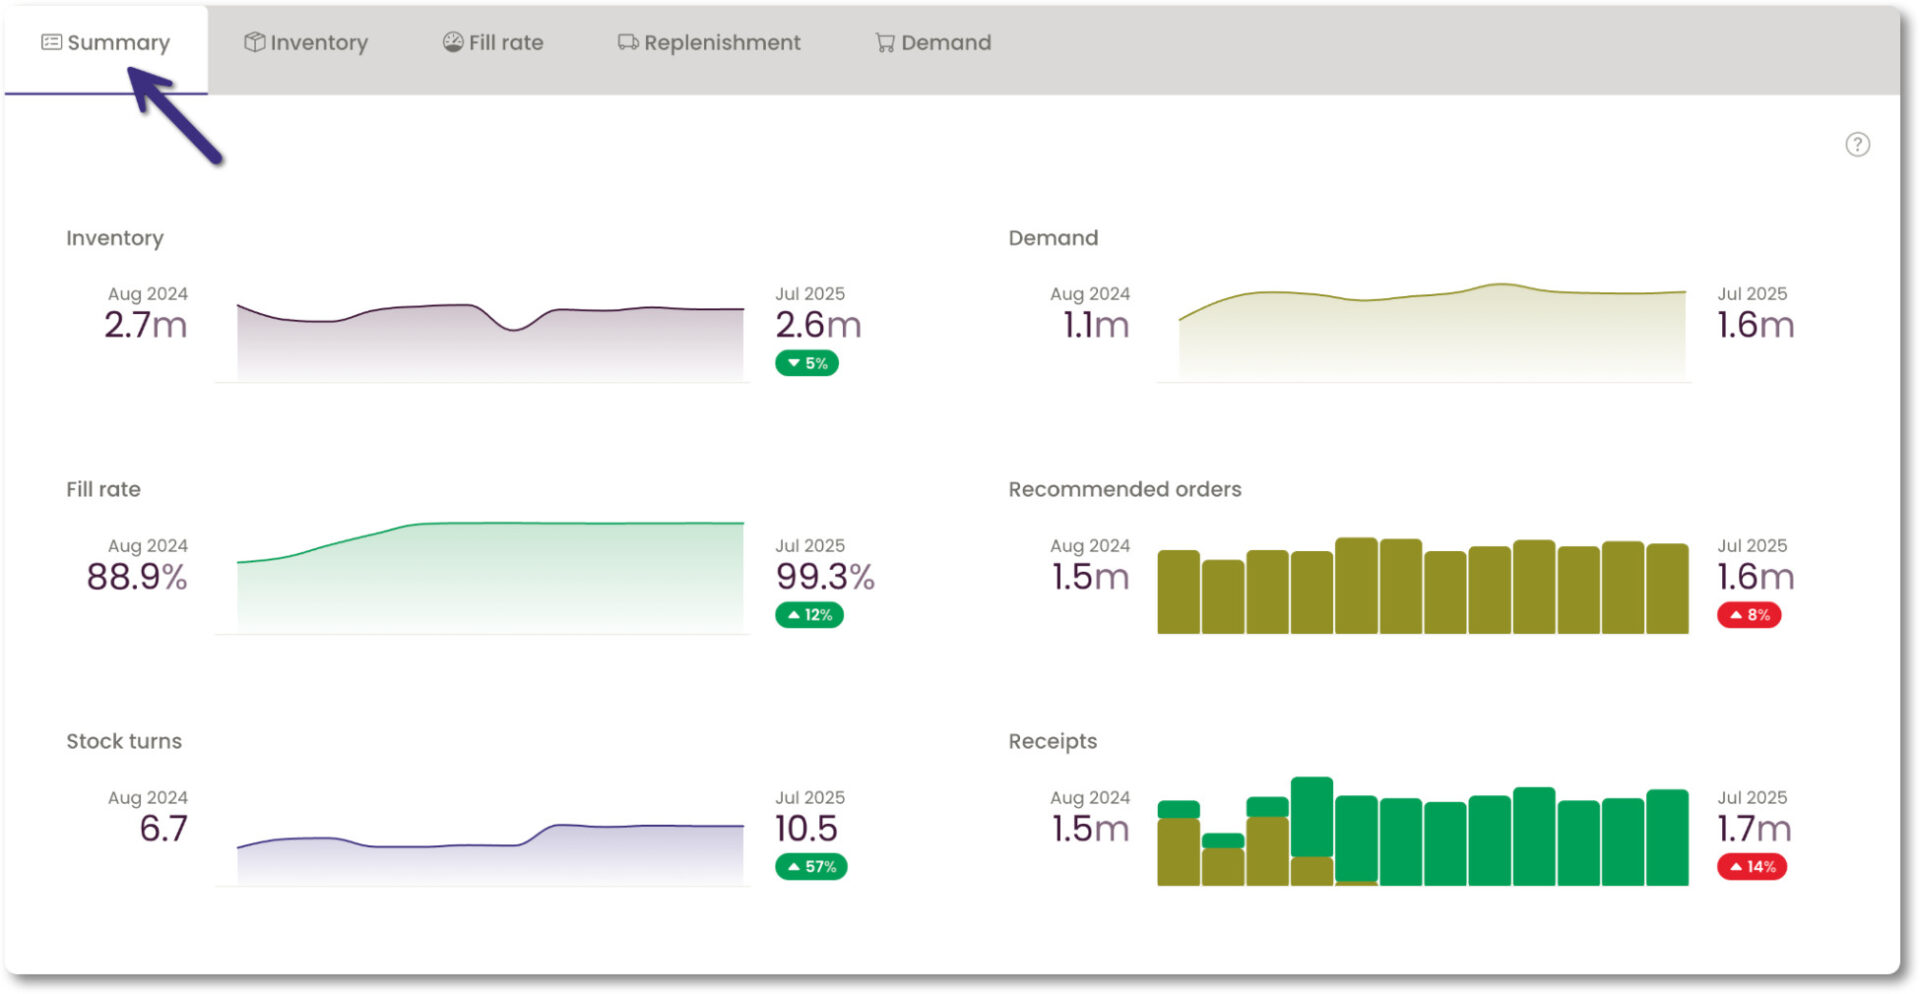
Executive Dashboard. This gives leadership a single view of business performance across five tabs:
- Summary: stock holding, excess, surplus orders, and stock-outs, plus trends in inventory value, fill rate, sales, and lost sales
- Inventory: day-by-day inventory health, including stock turns, SKU counts, and potential lost sales
- Sales: revenue and gross margin by location and product, including best-selling and most profitable products and locations
- Recommended Orders: order volumes, plus the gap between system recommendations and user changes
- Orders: overdue orders, open purchase and sales orders, and suppliers with risk
At Eustralis, management uses the Executive Dashboard to see order volumes and sales trends across every branch, without working through line-item detail. The business cut inventory by 35% while maintaining a 97% fill rate.
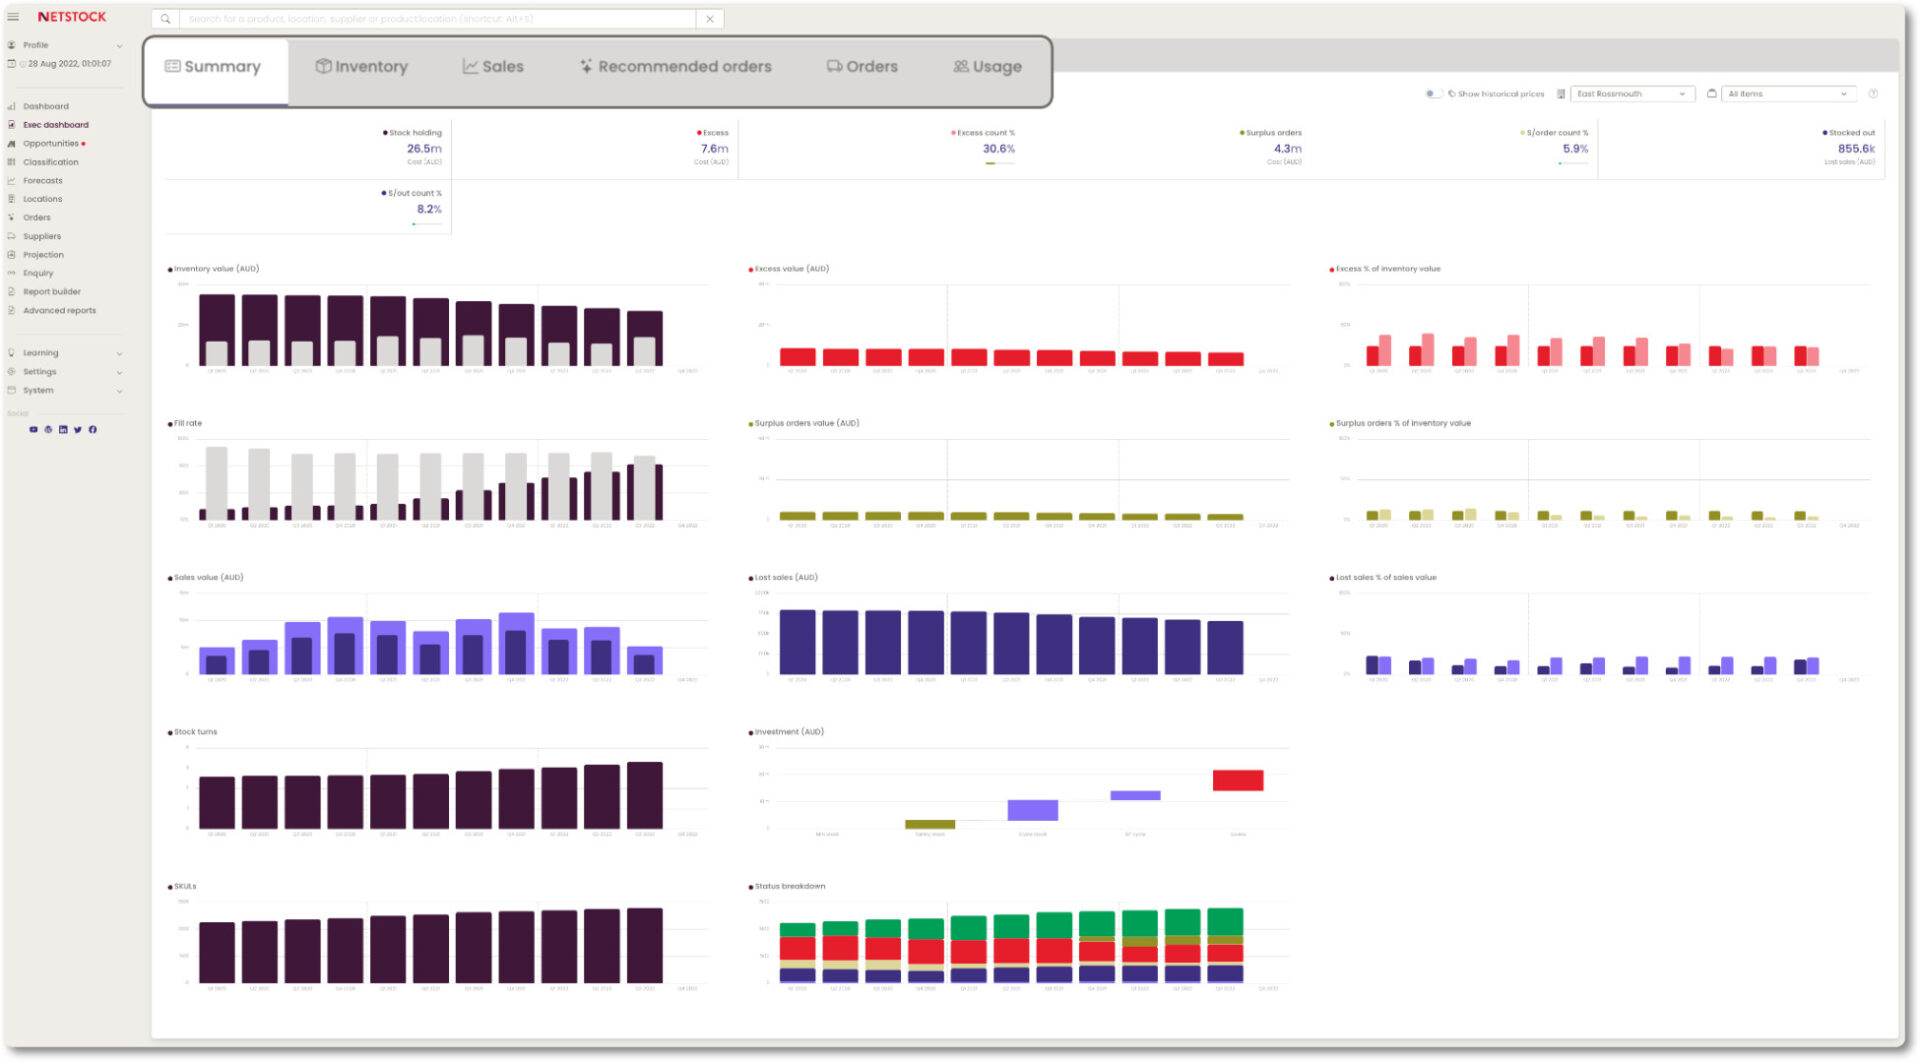
The Executive Dashboard Summary tab gives leadership a single view of inventory health across all locations.
Dashboard Analyzer. Part of the Netstock AI Pack, the Dashboard Analyzer reads the charts on the Executive Dashboard. It then writes concise executive summaries with strategic recommendations, ready for leadership meetings.
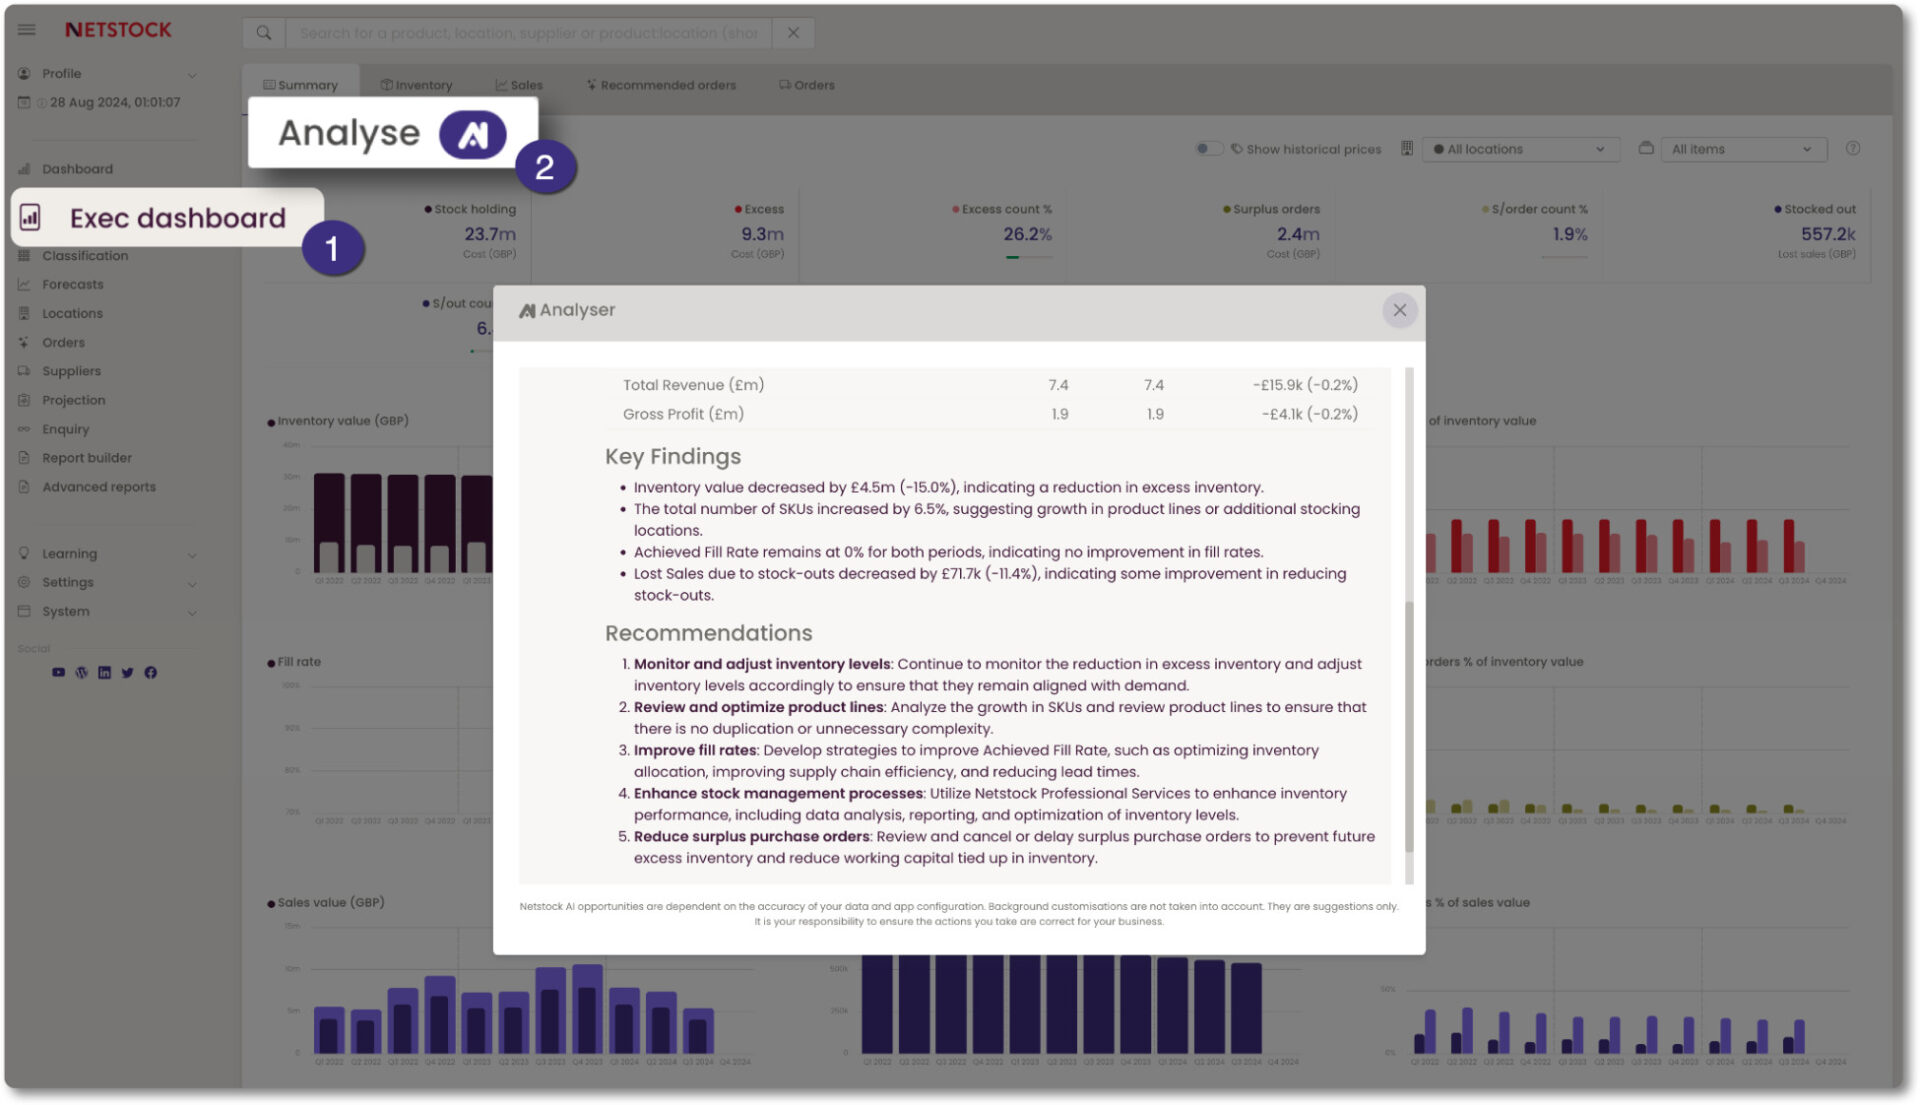
The Dashboard Analyzer turns Executive Dashboard charts into a written summary ready for leadership meetings.
AI Opportunities. Every day, Netstock AI™ analyzes inventory across all locations and identifies opportunities across four areas: potential stock-outs, actual stock-outs, surplus orders, and excess stock. Each opportunity describes the issue and suggests an action. That might be expediting an order, placing an emergency order, redistributing excess between locations, or canceling, reducing, or delaying a surplus order. AI Opportunities is included for all customers at no additional cost, and it learns from user feedback over time.
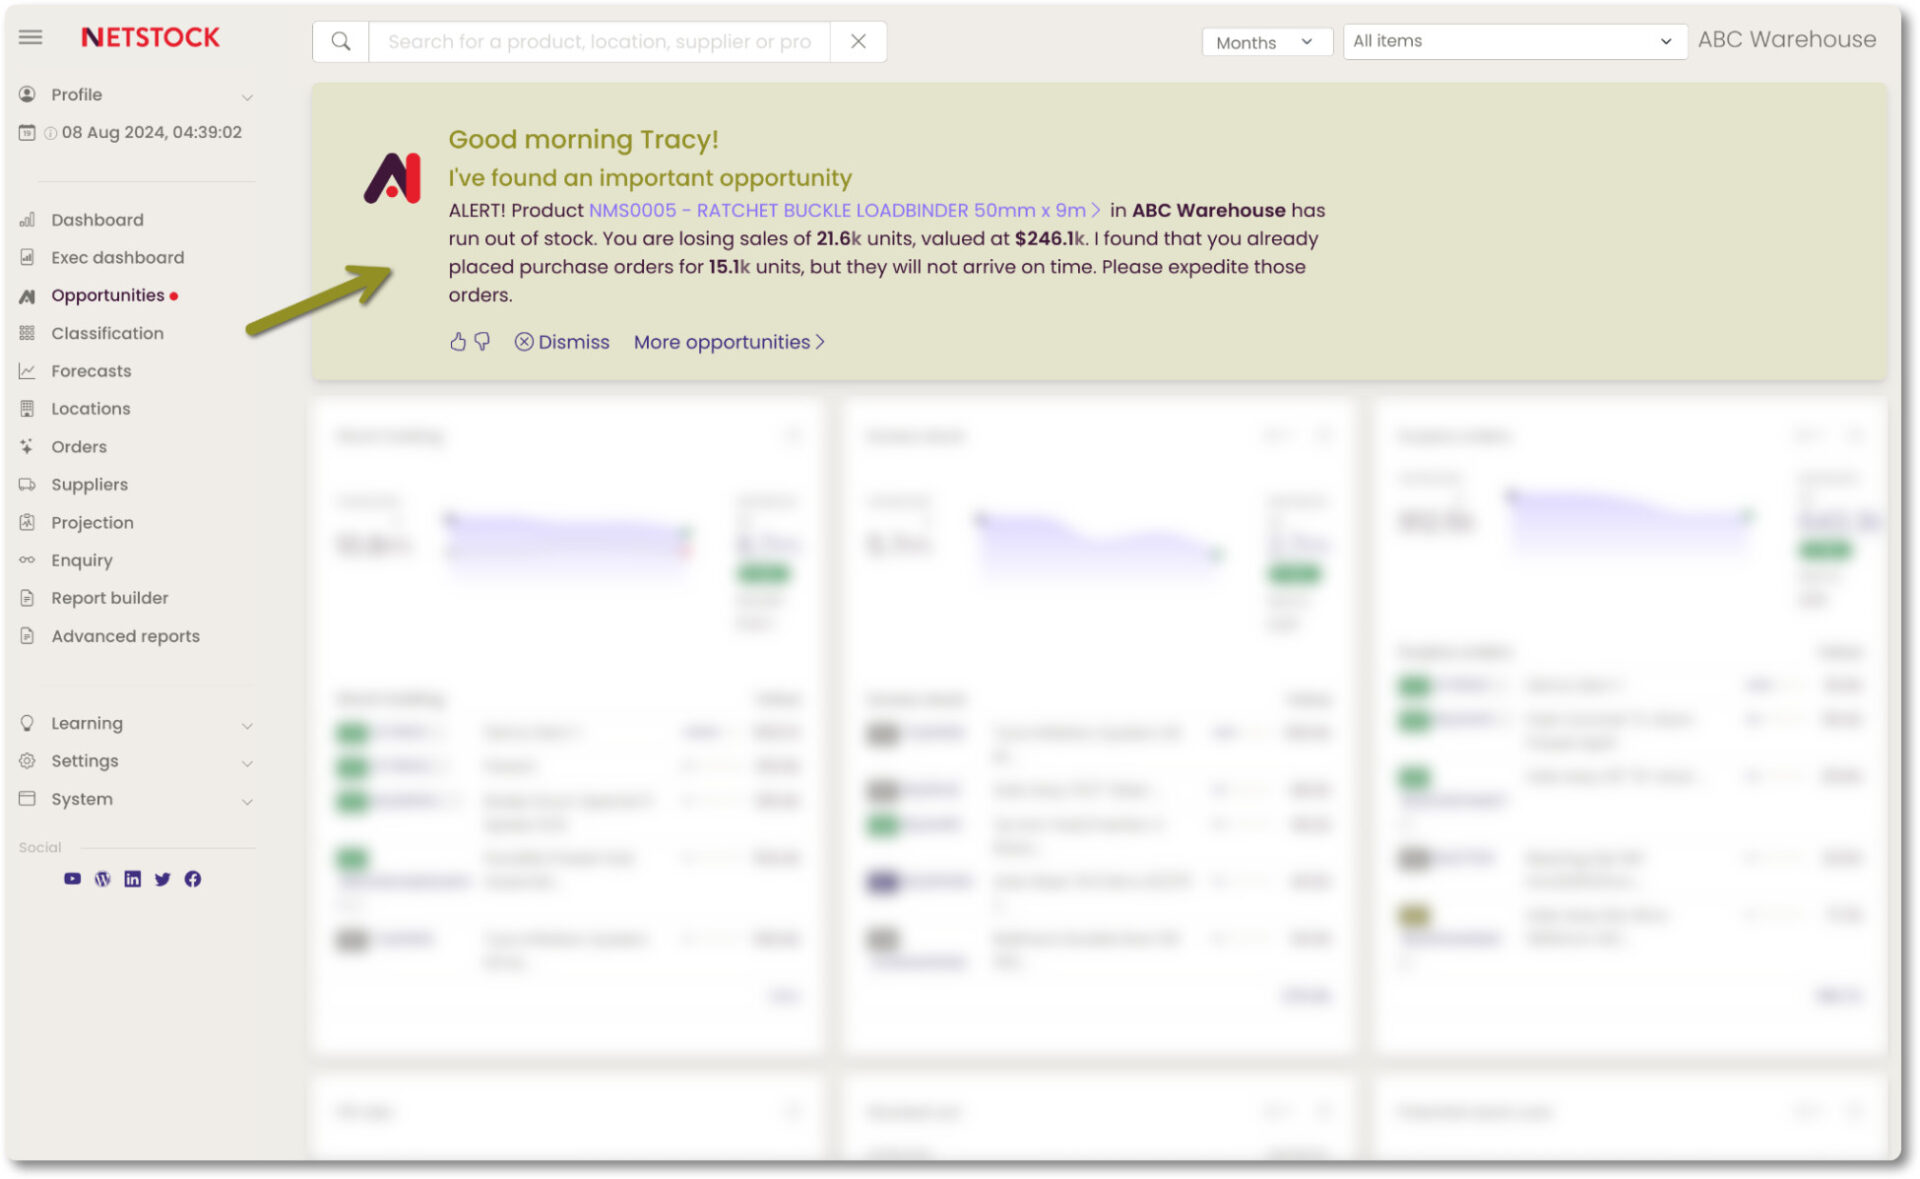
Netstock AI™ identifies opportunities daily and pairs each one with a suggested action.
Item Analyzer. Also part of the AI Pack, the Item Analyzer explains how any item reached its current status. It also suggests short-term remedies, such as redistributing excess or expediting an order.
Inventory classification matrix. Netstock combines Pareto (80/20 ABC) rules with sales velocity to plot items on a two-dimensional matrix. Items range from high-value, high-velocity to slow-moving or obsolete stock. Leaders can then focus capital and attention where it yields the highest return.
Real-world impact
- Sunbeam Foods fits the Dashboard section, because the case study credits the daily dashboard snapshot. In 17 months it cut inventory value by 52% and excess stock by 80%, and its fill rate rose to more than 99%.
- Select Hardware shows the classification matrix at work. It set separate stocking policies for fast and slow movers across 4,000+ SKUs and cut inventory by 25% in six months.
2. Building custom reports without IT
When a pre-built view doesn’t answer the question, planners can build their own report without waiting on IT.
Pre-built standard reports, one click away. Netstock includes many standard reports, opened by drilling into any KPI panel. Every table view can be downloaded as a CSV for further analysis.
Report Builder. Included in the Advanced bundle and above, Report Builder lets planners build unlimited custom .xlsx reports containing the concise information the business needs for daily operations. Reports can be once-off or scheduled to generate daily, kept private or shared with colleagues, so teams can collaborate on findings and make better decisions. To build a custom report in Netstock:
- Open Report Builder and select a base report type. Relevant columns are pre-selected and can be edited.
- Add filters, for example, by location, classification, or supplier.
- Add the columns you need and set the sort order.
- Preview the report to check it meets your expectations, then run and download it.
- Optionally, set the report to generate daily with fresh data, and choose whether to keep it private or share it with colleagues.
Saved reports stay on the list until deleted, so recurring analysis takes seconds to rerun. Where a report needs custom calculations or fields, Netstock’s team builds it as an advanced report to the business’s requirements.
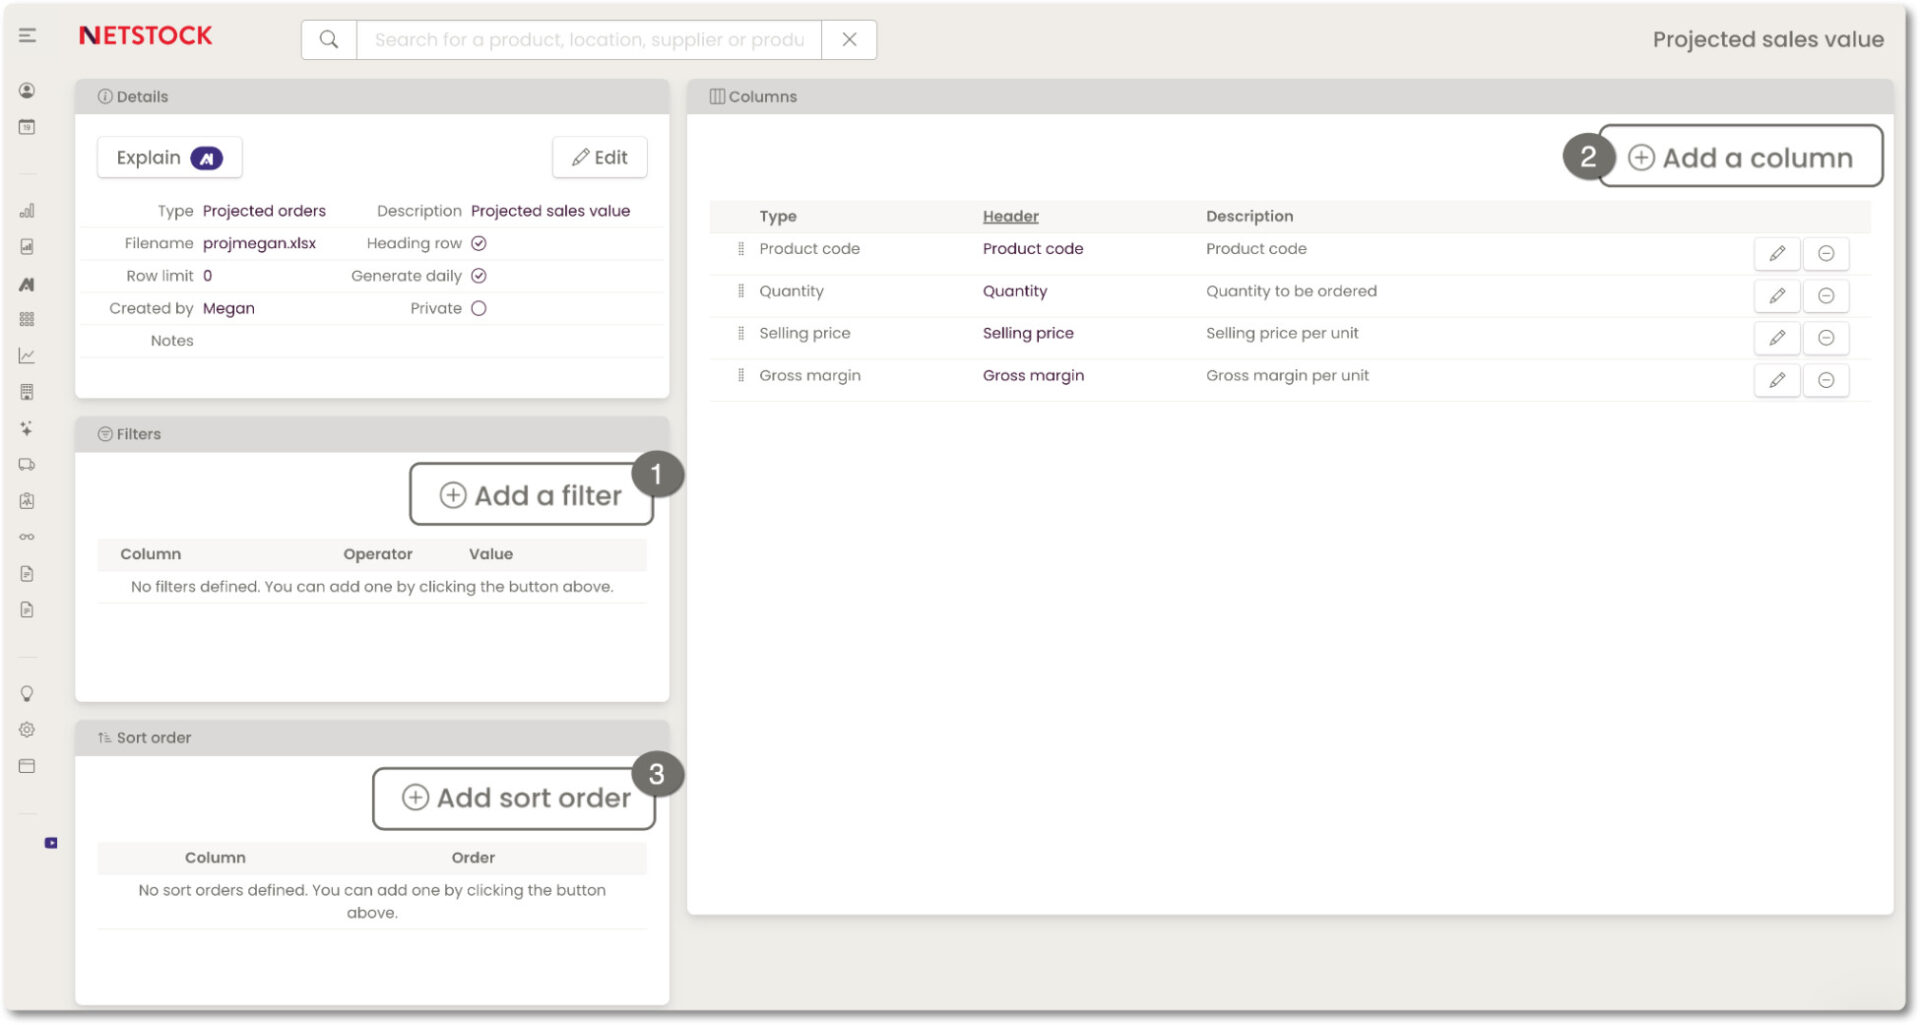
Report Builder lets planners build custom inventory reports by choosing filters, columns, and sort order, without IT support.
Report Explainer. Also part of the AI Pack, the Report Explainer summarizes the purpose of each report and explains how to use it to analyze inventory performance. This helps new team members get up to speed faster.
Data source for BI. For businesses with an established BI environment, Netstock data connects directly to Power BI, Tableau, or Looker Studio. Inventory metrics can then sit alongside sales, finance, and other company data in existing corporate dashboards.
3. Exporting for board and stakeholder presentations
Board conversations need forward-looking numbers, not just today’s operational picture. Netstock is built to support that shift.
Executive summaries from the Dashboard Analyzer. AI-written summaries of Executive Dashboard performance give planners a ready starting point for board packs and leadership updates.
12- to 24-month Stock Projection. Stock Projection, in the Advanced bundle and above, takes the current stock position and projects it forward using demand forecasts and policy settings. It shows:
- Projected inventory value, including excess and balanced stock
- Projected fill rate, stock turns, and cover days
- Future recommended orders, and when firm and projected receipts will arrive
- Forecast demand and projected lost sales
The standard horizon is 12 months. The Extended Planning Horizon, also in the Advanced bundle and above, extends it to 24 months to cover long lead times and seasonal planning. Projection data, including the filters used, downloads to CSV by month, ready for budgeting and capital planning models.
Stock Projection models inventory value, fill rate, and stock turns 12 months ahead, extendable to 24 months.
Stakeholder access beyond the planning tool. Through the BI data connection, department heads and executives who don’t log into Netstock daily can see inventory metrics in the dashboards they already use.
Confidence for owners and investors. For businesses that report to private equity owners or shareholders, Netstock’s daily data and forward projections give a consistent, transparent view of inventory performance. Race Winning Brands uses Netstock’s Executive Reports to track model stock, the target stock level Netstock recommends for each item. When sales rose over a six-month period, the reports showed the matching rise in model stock, which helped the business manage investor expectations. After its private equity acquisition, shareholders initially required daily check-ins; within two months of seeing the team’s command of Netstock, they scaled back their oversight.
Real-world impact
- Pharma Dynamics used long-term stock projection to safely optimize inventory holding. It reduced inventory value by over R40 million ($2.2M+) within 12 months while sustaining a 99.63% customer fill rate.
- Cut-n-Weld used 12-month stock projections, with support from Netstock Professional Services, and cut monthly forecast preparation from days to hours. Over five months, it reduced stock-outs by 39%, lifted fill rate from 77.7% to 86.6%, and cut excess inventory by over R1 million.
4. Purpose-built around what “good” looks like
General-purpose reporting platforms start as blank slates. Users must know which KPIs matter, which calculations to write, and how to interpret the results.
Netstock starts from inventory planning best practices instead. That practice comes from a team with over 100 years of combined planning expertise. Over $26 billion in inventory is managed through Netstock by more than 20,000 users worldwide.
Proven KPIs from day one. Fill rate, fill rate impact, stock holding, stock turns, cover days, and lost sales are defined and calculated automatically.
Clear definitions of a good outcome. Stock Projection spells out what success looks like. Inventory value falls while fill rate rises, or fill rate holds steady while inventory value falls. Stock turns end the period higher than they started. National Beauty Distribution has seen exactly that: for three years, its CEO has noted that inventory levels have kept falling even as sales have grown.
Answers, not just numbers. Dashboards show what is happening. The Item Analyzer explains why. AI Opportunities suggests what to do about it.
See the Item Analyzer in action

From reporting chore to strategic visibility
Netstock combines purpose-built dashboards, self-service custom reporting, and forward-looking stock projections. Together, they turn inventory reporting from a manual chore into a clear, shared view of the numbers that matter. On average, Netstock customers reduce inventory holding by 25% and improve fill rate by 15%. Planning managers spend less time preparing for meetings and more time leading them.