
NETSTOCK RESEARCH
Introduction
In 2025, supply chain challenges felt like a single, measurable storm (See: Netstock’s 2025 Supply Chain Planning Benchmark Report). Tariffs were the headline, and small and medium-sized businesses (SMBs) knew where to anchor their defenses. Strategies were clear: front-load orders and build buffer stock.
2026 stripped away that clarity. Tariffs remained a major pressure point, but they were far from the only challenge. The landscape shifted from a year of singular shocks to one defined by supply chain chaos, where trade-policy changes, shipping-route disruptions, raw-material costs, demand shifts, and uneven supplier performance converged at once. This report uses the term supply chain chaos to describe a different kind of disruption: volatility shifts one variable at a time, while chaos moves several at once, leaving planners without a stable baseline for decision-making. For SMBs, these disruptions are no longer isolated; they compound.
In 2026, strong performance has taken on new meaning. This report examines how businesses responded to increasing pressures by improving inventory visibility, refining supplier strategies, adopting AI, and planning for peak seasons. Through these efforts, they have redefined performance standards. The result is not a sector in decline, but one where strong performance is measured differently than it was a year ago.
Demographics and methodology
Netstock drew insights from anonymized, aggregated platform data across 2,500+ customers worldwide. Additionally, Netstock surveyed over 150 users representing small and medium-sized businesses (under $250M in revenue) globally.
Benchmark report highlights
- No single disruption dominates: No single pressure defines inventory planning. Lead-time swings (29%), raw-material costs (23%), freight and shipping (22%), and demand shifts (21%) rank as near-equal challenges.
- Visibility is the first response to disruption: 60% of SMBs review inventory and identify at-risk SKUs when disruption hits.
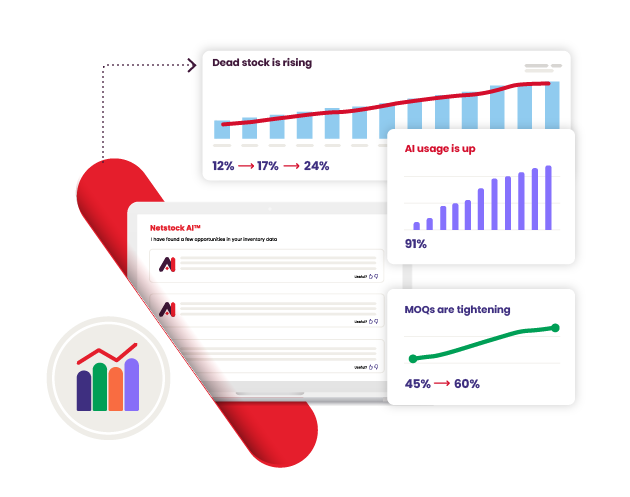
- Stock turns hit a three-year high, but dead stock is up: The typical business now turns inventory 4 times a year, and top performers turn it 7 times, both three-year highs. Yet 24% of SMBs report more than 10% of inventory as dead stock, up from 12% in 2024.
- Strong performance is a mix of strengths, not a single formula: 73% of SMBs met two or three of four key performance indicators, while only 7% met all four.
- Supplier reliability is under growing pressure: Lead-time variability affects 74% of SMBs, while long lead times affect 63%, and MOQs 60%.
- Growth continued through the complexity: 99% of SMBs launched new products, expanded existing ranges, or did both in 2026, up from 93% in 2025.
- AI has moved from adoption to usage: SMBs are now split between general-purpose tools (29%) and purpose-built vendor tools (22%), while 53% plan to increase AI investment this year.
- In preparation for peak season, most are ordering earlier: 53% of SMBs are ordering earlier or in larger quantities, while 39% are relying more on forecasting and planning tools. Among businesses ordering earlier, only 44% report service above 90%, compared with 62% of everyone else.
No single disruption dominates
2026 was defined by several planning pressures becoming equally difficult to ignore. In 2025, tariffs gave SMBs one clear problem and a recognizable set of responses. This year, supplier timing, input costs, freight, and demand all shifted at once, leaving planners without a clear hierarchy of what to address first. The data confirms just how evenly matched these pressures became: asked to rank the factors that most affected inventory planning, SMBs’ top responses were nearly tied: supplier lead-time swings (29%), raw material and input costs (23%), freight and shipping costs (22%), and demand shifts (21%).
The first-place rankings show that no single issue dominates as the biggest problem for SMBs. Looking across the three pressures selected the data shows how widespread those challenges are: supplier timing appears in 77% of responses, freight in 72%, raw-material/input costs in 66%, and demand shifts in 57%. In other words, most SMBs are juggling multiple pressures at once.
That does not mean lead times got worse for every business. They look steady when you average them across the board, but in Q2 2026, the fastest-moving businesses (“Stars”) averaged 21.0 days, while the slowest (“Stragglers”) averaged 79.3 days. And underneath that overall average, different regions and industries were moving in completely different directions.
No single planning pressure dominates | 2026
A steady global number doesn’t disprove the chaos story. It’s exactly what you’d expect from it. The problem isn’t that every business got worse; it’s that businesses were dealing with different conditions at the same time.
Lead day benchmark trend | 2026
How chaos changes what strong performance looks like
Resilience in 2026 has no one-size-fits-all playbook. It isn’t about hitting every inventory measure on the scorecard; it’s about recognizing which problem matters most right now and acting on it without losing control of everything else. Strong service can coexist with dead stock; efficient inventory movement can coexist with availability pressure. There’s no single combination of results that defines the strongest businesses, only the ability to make the right call under pressure, again and again.
The scorecard looks across four measures:
- An active strategy for reducing excess inventory
- Service levels above 90%
- Use of at least one alternative procurement strategy
- Dead stock below 5% of excess inventory
Among the respondents across all four measures, 73% met two or three, while only 7% met all four.
Survey Scorecard: Several things right, rarely everything | 2026
The individual measures show why strong overall performance is difficult to achieve. While 93% of SMBs have an active excess-reduction strategy, only 53% report service levels above 90%. Just 34% use at least one alternative procurement strategy, and only 32% report dead stock below 5% of excess. A business can be strong in one area and still fall short in others, making it difficult to perform well across all four measures. Which is exactly why no single measure tells the full story.
Even under this much pressure, growth didn’t stall. 99% of SMBs launched new products, expanded existing ranges, or did both in 2026. This is proof that chaos changed how businesses managed inventory, not whether they kept moving forward.
Product expansion continued despite disruption | 2026
Better inventory management, worse dead stock
SMBs cleared excess stock more aggressively in 2026, and yet dead stock grew. That’s not a contradiction; businesses aren’t holding more inventory, just more of the wrong inventory. SMBs are turning over their inventory faster than they have in three years. The typical business now cycles through stock roughly four times a year, though top performers turn inventory closer to eight times, pulling the average higher.
The improvement is broad. The typical business is also turning stock faster, not just the businesses already ahead. Service levels improved as well: the share of SMBs reporting service above 90% rose from 41% in 2024 to 53% in 2026.
Filling Orders vs Stock Turns Behaviors Quadrant | 2026
1 Under-Stocked - 9% of SMBs: High stock turns but low fill rates; inventory moves fast but not fast enough to keep up with demand. Likely a sign of stock mix or capital issues rather than a lack of hustle.
2 Running lean and filling orders - 12% of SMBs: The sweet spot: high fill rates paired with high stock turns. These businesses are moving inventory quickly without leaving demand unmet.
3 In stock trouble - 24% of SMBs: Low fill rates and low stock turns together are the toughest combination. Inventory isn't moving, and demand still isn't being met.
4 Well on the way to optimization - 54% of SMBs: Strong fill rates, but slower stock turns; the majority of SMBs sit here. Demand is being met, though there's room to move inventory faster without compromising service.
Fill rate and stock-turn data show a similar picture. Two-thirds of customers sit on the higher-fill-rate side of the chart, although only 12% pair that with stock turns above nine. Faster inventory movement is becoming more common, but it does not always translate into the right stock being available when customers need it.
High dead stock has risen three surveys in a row | 2026
Even so, dead stock kept climbing: the share of excess reported as dead stock rose from 12% in 2024 to 24% in 2026, while the share of businesses holding almost none (under 5%) fell from 49% to 32% over the same period. The three-year climb suggests this is more than a temporary swing: a harder-to-predict supply-and-demand environment is leaving more businesses with inventory that no longer matches what customers need.
That makes visibility especially important when conditions change. When disruption hits, 60% of SMBs say their first move is to review available inventory and identify at-risk SKUs, giving them a clearer basis for deciding whether to discount, liquidate, redistribute, or take another action. The role of supply chain planning technology is to make that first check faster and more precise. Only 3% start by reviewing cash flow or working capital, even though financing is where the clearest pressure appears in this year’s data.
Understocking Behaviors Quadrant | 2026
1 Building pressure - 5% of SMBs: Lost sales are still low, but stock-out risk is climbing. A signal to act on purchase orders and supplier lead times before it turns into a bigger problem.
2 High risk - 13% of SMBs: Both current lost sales and forecasted stock-outs are elevated. These businesses must pay urgent attention to forecasting, ordering, and supplier relationships.
3 Ideal position - 57% of SMBs: Low lost sales and low stock-out risk, the strongest combination in the data. Worth noting, this position can also be reached by holding excess stock, so it's best read alongside overstocking metrics rather than on its own.
4 Losing ground - 24% of SMBs: Lost sales are already elevated, even though near-term stock-out risk looks contained. This is a sign that demand has shifted and planning hasn't caught up yet.
That visibility matters because SKU availability issues can manifest in different ways. While 57% of customers sit in the ideal low-lost-sales position, more than four in ten fall elsewhere on the chart, dealing with supplier pressure, elevated lost sales, or both.
At the same time, businesses used more tools than ever to clear excess. Promotions and sales rebounded to 77% this year, after dipping to 69% in 2025. Liquidation held near 39%, up sharply from 27% in 2024. Redistribution climbed from 27% to 34%. Half of SMBs now use at least two of these three methods, up from 38% in 2024 and 40% in 2025.
Netstock’s behavioral data show the same active response to excess. The largest group, 37%, is already cutting surplus orders and taking steps to burn excess down, although another 27% still carry excess without sufficiently changing their buying behavior.
Overstocking Behaviors Quadrant | 2026
1 Stocking up - 16% of SMBs: A deliberate move to front-load inventory for promotions, launches, or seasonal peaks. The priority here is ensuring these strategic builds don't become dead stock later.
2 Deer caught in the headlights - 27% of SMBs: Businesses are blindsided by market shifts or are relying on outdated buying habits. They need to immediately cancel surplus orders and start a rapid reduction plan.
3 Ideal position - 19% of SMBs: Inventory is under control. Any excess stock held is purposeful and planned, showing a clear balance between carrying costs and strategic requirements.
4 Addressing the issue - 37% of SMBs: The strongest operational group. These businesses have already begun curbing surplus orders; the next step is to maintain this discipline to burn off existing excess.
Excess-reduction methods between 2024 and 2026
The amount of inventory held by a typical business has remained remarkably stable. Look at the typical business (the middle of the range, not skewed by a few very large holders): inventory value has stayed in a narrow $3.8M–$4.0M range for three years, landing at $3.91M in Q2 2026. Earlier ordering hasn’t meaningfully increased what a typical business holds. What’s changed is the composition of that inventory, meaning businesses are clearing more inventory overall, and a growing share of what’s left behind has stopped moving altogether.
Buying behavior is improving unevenly. More customers are running lean, but the largest group still replenishes inventory without sufficiently adjusting orders to what is actually selling.
Excess-reduction methods, 2024–2026
Ordering vs Stock Turns Behaviors Quadrant | 2026
1 Running lean - 16% of SMBs: Businesses maintaining tight inventory control and matching orders closely to sales to keep warehousing and holding costs to a minimum.
2 Stocking up - 5% of SMBs: Strategic ordering to secure bulk discounts, promotions, or seasonal surges. The main challenge is preventing these bulk buys from turning into long-term excess.
3 Insufficient forward planning - 58% of SMBs: The largest cohort. While some are navigating supply chain constraints, most are replenishing stock without adjusting orders to match what is actually selling.
4 Overstocked - 21% of SMBs: Low stock turns coupled with high order volumes. These businesses need to immediately stop surplus purchasing and build an aggressive plan to reduce excess inventory.
Stock turn estimates
Clearing excess and dead stock are two different piles of stock, not two sides of the same coin. One is inventory that businesses are actively working to move through promotions, liquidation, or redistribution. And that pile is shrinking faster than ever. The other is inventory that’s simply stopped moving and been written off as dead. A business can get much better at clearing the first pile, while the second pile quietly keeps growing because nobody’s targeting it.
Stock Turn estimates | 2026
How inventory gets paid for
Not every business carries dead stock the same way. Businesses financing inventory with credit now report dead stock levels above 10% at a rate of 35%, compared with just 13% for those that do not use credit, a gap that first appeared in 2025 and has widened this year.
Overstocking vs Understocking Behaviors Quadrant | 2026
1 Unexpected change - 12% of SMBs: Businesses grappling with severe supply chain disruptions or sudden demand shifts. If these conditions persist, they risk sliding into a significant overstock situation.
2 Danger zone - 25% of SMBs: The most critical group. Inventory levels are high, but the mix is wrong, meaning capital is tied up in excess while customers still cannot get what they need. These businesses should prioritize redistributing excess to meet demand.
3 Ideal quadrant - 23% of SMBs: The benchmark for disciplined planning. These businesses have successfully balanced inventory levels with customer demand.
4 Planned excess - 40% of SMBs: While these businesses carry higher excess, it is intentional, often to maintain strategic stock, such as critical spares or bulk buys for rebates. The main risk here is redundancy if that stock stops moving.
One in four SMBs now sits in the “danger zone,” carrying excess inventory while also missing sales. That reinforces the broader trendline that better excess management does not always mean having the right inventory in the right place.
Stars & stragglers: where the gap widens
While top-performing SMBs (“Stars”, the 75th+ percentile) and bottom-performing SMBs (“Stragglers” the bottom 25th percentile) face the same supply chain chaos, they do not experience it the same way. A strong baseline keeps Stars less exposed, while Stragglers struggle to keep pace. Performance gaps have remained remarkably stable across efficiency, supplier timing, inventory, and availability metrics, with one glaring exception: lost sales. Despite overall improvements in stock turns, the gap in lost sales between the two groups is widening. These cohorts are defined by outcome, not by strategy, so the consistency of the gap says more about where businesses ended up than how they got there.
Stock turn
Stock Turn | Stars
| Geography | Manufacturing | Other | Retail | Wholesale |
|---|---|---|---|---|
| North America | 7.2 | 9.0 | 7.3 | 7.1 |
| Europe & UK | 8.5 | 8.3 | 5.3 | 5.1 |
| Africa & Other | 11.9 | 14.4 | 18.6 | 10.6 |
| APAC | 9.7 | 7.6 | 5.9 | 7.1 |
Stock Turn | Stragglers
| Geography | Manufacturing | Other | Retail | Wholesale |
|---|---|---|---|---|
| North America | 2.2 | 2.3 | 2.3 | 2.3 |
| Europe & UK | 2.7 | 2.9 | 2.4 | 2.3 |
| Africa & Other | 3.1 | 4.1 | 3.7 | 2.7 |
| APAC | 2.8 | 2.5 | 2.7 | 2.3 |
- Stars: Turn inventory 7.9 times a year on average, improving in 15 of 16 geography and industry benchmarks from 2025 to 2026.
- Stragglers: Turn inventory 2.5 times a year, with 9 of 16 benchmarks improving and another 4 holding flat.
Inventory is moving faster across most of the customer base. Stars are still moving it more than three times as quickly as Stragglers.
Overstocking
Overstocking | Stars
| Geography | Manufacturing | Other | Retail | Wholesale |
|---|---|---|---|---|
| North America | 25% | 26% | 21% | 25% |
| Europe & UK | 22% | 24% | 27% | 24% |
| Africa & Other | 32% | 28% | 28% | 29% |
| APAC | 29% | 24% | 28% | 24% |
Overstocking | Stragglers
| Geography | Manufacturing | Other | Retail | Wholesale |
|---|---|---|---|---|
| North America | 48% | 50% | 50% | 52% |
| Europe & UK | 42% | 51% | 52% | 47% |
| Africa & Other | 52% | 53% | 45% | 52% |
| APAC | 50% | 45% | 49% | 43% |
- Stars: Carry 25% relative overstocking, improving in 11 of 16 geography and industry combinations.
- Stragglers: Carry 49% relative overstocking, roughly twice the burden, improving in only 8 of 16 combinations, flat in 3, worse in 5.
This doesn’t contradict rising dead stock elsewhere in the report. Overall excess can shrink while a larger share of what remains stops moving.
Understocking
Understocking | Stars
| Geography | Manufacturing | Other | Retail | Wholesale |
|---|---|---|---|---|
| North America | 3.2% | 2.4% | 2.5% | 2.7% |
| Europe & UK | 3.1% | 1.7% | 3.4% | 2.1% |
| Africa & Other | 2.6% | 3.7% | 3.4% | 3.4% |
| APAC | 4.1% | 2.3% | 3.0% | 2.2% |
Understocking | Stragglers
| Geography | Manufacturing | Other | Retail | Wholesale |
|---|---|---|---|---|
| North America | 20% | 19% | 16% | 15% |
| Europe & UK | 15% | 11% | 19% | 7% |
| Africa & Other | 22% | 24% | 22% | 12% |
| APAC | 16% | 13% | 15% | 10% |
- Stars: Lost sales increased slightly from 2.2% of inventory value in Q2 2025 to 2.7% in Q2 2026.
- Stragglers: Lost sales rose from 12% to 15.0% over the same period, widening the gap between the two groups from roughly 10 to 12 percentage points.
Lost sales worsened for both groups, but the increase was much larger among Stragglers. Even as inventory turns improve across the customer base, the availability gap between stronger and weaker performers is widening.
Lead Times
Lead Times | Stars
| Geography | Manufacturing | Other | Retail | Wholesale |
|---|---|---|---|---|
| North America | 25.7 | 19.1 | 22.1 | 18.7 |
| Europe & UK | 32.5 | 15.5 | 22.3 | 22.7 |
| Africa & Other | 12.4 | 14.6 | 9.9 | 12.7 |
| APAC | 31.1 | 24.8 | 23.3 | 22.8 |
Lead Times | Stragglers
| Geography | Manufacturing | Other | Retail | Wholesale |
|---|---|---|---|---|
| North America | 76.8 | 75.3 | 103.9 | 83.1 |
| Europe & UK | 113.1 | 72.1 | 93.0 | 82.7 |
| Africa & Other | 54.2 | 52.9 | 39.1 | 76.1 |
| APAC | 81.8 | 72.8 | 83.8 | 77.2 |
- Stars: Average 21.0 lead days.
- Stragglers: Average 79.3 lead days. The direction of change depends heavily on where a business sits: Europe/UK manufacturing Stragglers moved from roughly 73 to 113 days, while Africa retail Stragglers improved from roughly 55 to 39.
A stable global average can hide exactly this kind of divergence. Looking at individual regions and industries gives a clearer picture of 2026’s chaos than the lead-days average alone.
Fill rate
Fill rate | Stars
| Geography | Manufacturing | Other | Retail | Wholesale |
|---|---|---|---|---|
| North America | 92.4% | 93.6% | 93.3% | 92.3% |
| Europe & UK | 93.9% | 93.5% | 92.6% | 93.4% |
| Africa & Other | 88.5% | 89.8% | 88.6% | 91.2% |
| APAC | 92.9% | 93.3% | 94.2% | 94.1% |
Fill rate | Stragglers
| Geography | Manufacturing | Other | Retail | Wholesale |
|---|---|---|---|---|
| North America | 73.2% | 66.9% | 73.8% | 77.0% |
| Europe & UK | 77.3% | 78.6% | 65.7% | 80.1% |
| Africa & Other | 63.2% | 68.5% | 69.3% | 75.2% |
| APAC | 71.7% | 76.8% | 65.2% | 81.7% |
- Stars: Fill 93.0% of demand.
- Stragglers: Fill 74.7%, an 18-point gap.
Stars are turning inventory faster and keeping more of it available at the same time. Stragglers carry more excess and still miss more demand, showing that speed and availability aren’t a trade-off for the strongest performers.
More sourcing options, a bigger China problem
More SMBs are sourcing from multiple regions than a year ago. Across the four supplier regions measured consistently in all three benchmark reports, the United States, China, Canada, and Mexico – the share sourcing from at least two rose from 45% in 2024 to 49% in 2025 to 55% in 2026. That reduces dependence on any single source, but it comes with a real cost: more suppliers, more lead times, and more freight routes to manage. For SMBs, the benefit is having alternatives when one source gets disrupted, not a guarantee of better overall performance.
China’s lead-time gap widened sharply this year. In 2025, 61% of SMBs sourcing from China cited long supplier lead times, compared with 52% of businesses sourcing elsewhere. In 2026, those figures moved to 75% and 42%, widening the gap from 9 to 33 percentage points.
Lead Days by geography and industry | Stars
| Geography | Manufacturing | Other | Retail | Wholesale |
|---|---|---|---|---|
| North America | 25.7 | 19.1 | 22.1 | 18.7 |
| Europe & UK | 32.5 | 15.5 | 22.3 | 22.7 |
| Africa & Other | 12.4 | 14.6 | 9.9 | 12.7 |
| APAC | 31.1 | 24.8 | 23.3 | 22.8 |
Lead Days by geography and industry | Stragglers
| Geography | Manufacturing | Other | Retail | Wholesale |
|---|---|---|---|---|
| North America | 76.8 | 75.3 | 103.9 | 83.1 |
| Europe & UK | 113.1 | 72.1 | 93.0 | 82.7 |
| Africa & Other | 54.2 | 52.9 | 39.1 | 76.1 |
| APAC | 81.8 | 72.8 | 83.8 | 77.2 |
The gap between regions can be stark. North American retail Stragglers report roughly 104 lead days, one of the clearest outliers in the platform data, and a sign of how much geography still shapes supplier timing even as sourcing broadens.
More sourcing options reduce the risk of relying too heavily on a single supplier or region, but they don’t simplify the supply chain. Diversification is likely the right resilience move, but it adds a management burden that’s harder for lean SMB planning teams to absorb than it is for a large enterprise. This operational trade-off may be driving a shift in sentiment: since 2024, stated preference for offshore sourcing has declined annually (31% to 28% to 21%), while preference for domestic sourcing has risen steadily (19% to 21% to 23%). The data suggests a multi-year cooling in offshore dependence, even as China remains a central, albeit more complex, part of the supply base. Furthermore, the percentage of SMBs sourcing from 2+ supplier regions has grown by 10%, signaling that supplier networks continue to expand even amid ongoing global supply chain chaos.
Supplier breadth and China lead-time comparison | 2026
Share of SMBs sourcing from 2+ supplier regions
Share of 2026 respondents citing long supplier lead times, by China sourcing status
Supplier reliability is under pressure
Supplier reliability has returned to or exceeded its 2024 levels, marking a structural shift away from the brief reprieve seen in 2025. While SMBs faced a mix of challenges last year, 2026 data show these reliability pressures are now compounding. Notably, while metrics for timing and availability have surged, supplier cost pressures have remained comparatively stable, signaling that the primary issue in 2026 is not price, but predictability.
This unpredictability hits SMBs harder than large enterprises because fewer have the practical option to switch suppliers when problems hit. Only 35% of U.S. SMBs changed suppliers due to tariffs in the prior 12 months. The other 65% stayed put, held back by the cost of switching, the risk of even longer lead times during a transition, and the money required to qualify a new supplier. Among the businesses that did switch, cost was the primary reason (44%), followed by country-of-origin risk (26%), supplier reliability (15%), and tariff-driven lead-time changes (11%).
Top supplier challenges | 2024–2026
Some of 2025’s supplier-collaboration gains didn’t hold. Vendor Managed Inventory (VMI) jumped from 29% to 44% in 2025, then fell back to 20% in 2026. Consignment followed a similar path, rising from 19% to 25%, then dropping to 17%. In 2026, 68% of SMBs said they use no alternative procurement strategies. This retreat suggests that while VMI and consignment are effective, they require a level of supplier alignment and operational consistency that became difficult to sustain as supply chain chaos compounded.
Alternative procurement strategies | 2024–2026
That reversal doesn’t mean these tactics stopped working. It’s more likely that 2025’s gains were never as settled as they looked, and 2026 shows where things actually stand. What’s notable is that this happened at the same time SMBs were getting faster at moving inventory overall, proof that internal efficiency gains and external supplier conditions can move in completely opposite directions. For smaller teams with fewer sourcing options to begin with, managing around an unreliable supplier base is especially hard.
Stock Turn Estimates | 2026
Looking toward peak planning season
Peak holiday season raises the stakes for SMB inventory planning. In the Q4 2025 Small Business Index, 79% of small businesses said the holiday season was important to overall profit, rising to 91% among retailers specifically.
With annual profits on the line, many SMBs are prioritizing earlier ordering as their primary response. 53% of SMBs are ordering earlier or in larger quantities this year, and 39% are leaning more heavily on forecasting and planning tools. Far fewer are switching suppliers, just 10%, a sign that most SMBs are trying to make better decisions inside their current network rather than assuming they can simply replace suppliers.
Peak season preparation | 2026
But ordering earlier isn’t automatically better.
Among businesses ordering earlier, only 44% report service above 90%, compared with 62% among everyone else. Dead stock rates aren’t meaningfully better for the early-order group either. That suggests early buying often reflects existing availability pressure more than it reflects a proven strategy.
Service levels among earlier-ordering businesses | 2026
The availability gap between high and low performers is already wide, heading into peak season. Top-performing ‘Stars’ protect their margins by losing just 2.7% of inventory to lost sales while filling 93.0% of demand. In contrast, ‘Stragglers’ are far more exposed, losing 15.0% of inventory value to lost sales and filling only 74.7% of demand. Moving a purchase forward, ordering earlier, might seem like a safety net, but it can actually increase risk if the underlying demand signal is wrong. The better approach is to check current inventory and demand first, then decide whether ordering earlier actually reduces risk, rather than defaulting to it.
AI moves into everyday use
Last year’s benchmark measured a rush into AI adoption. This year’s survey asks a more useful question: not just whether SMBs use AI, but how far they’ve progressed, what tools they use, and whether investment is still progressing. Many are still exploring or testing, but AI is already entering inventory workflows through both general-purpose tools and purpose-built vendor products.
Asked to describe their current AI maturity, 34% of SMBs say they aren’t using AI for supply chain planning at all, 29% are exploring it, 25% are testing limited workflows, and just 6% use it day-to-day or describe it as fully embedded. But how AI actually enters the workflow tells a different story: 29% use general-purpose tools like ChatGPT, Claude, or Gemini, and 22% primarily rely on purpose-built vendor tools. Investment intent backs this up. 53% expect AI spending to increase over the next 12 months, and no respondent selected a decrease in AI spending.
AI maturity and tool adoption | 2026
How mature is your organization’s use of AI?
How does your organization integrate AI into business operations?
Netstock’s own platform data shows the same shift. Engagement with Netstock’s AI-powered recommendation tool has remained at 91% of active customer accounts through both Q1 and Q2 2026, while average usage per account has increased.
AI impact vs. real-world pain
Where SMBs expect AI to help doesn’t fully match where the pain actually is. Respondents ranked forecasting demand (24%) and automating repetitive planning tasks (21%) as the leading areas of positive AI impact, but just 5% expect AI to help identify supplier or lead-time risks earlier, despite supplier timing being one of the year’s most common planning pressures. Some businesses are already using AI tools day-to-day while still describing themselves as early-stage users. What the data clearly shows is a growing reliance on AI across planning workflows; however, there is no measurable improvement in the outcomes that matter most. In 2024, 21% of SMBs reported that AI provided inconsistent or inaccurate answers. In 2026, that figure rose to 36%, the largest two-year move of any answer option anywhere in this survey.
Adoption alone doesn’t separate the strong performers from the weak ones. Businesses testing or using AI report service levels and dead stock rates that are statistically indistinguishable from those that aren’t, suggesting the difference lies in what the tools are pointed at rather than in whether they’re in use.
Rising concerns about data integrity and accuracy suggest that AI has moved beyond the experimentation phase. The access barriers that defined 2024 have receded, with the share of SMBs that are not using AI or are unsure how it works roughly halved since then. What has grown in their place are concerns about real use: data integrity and security are now the top challenge for three years running, up from 23% of respondents in 2024 to 39% in 2026. Businesses are confronting AI’s practical limits through use rather than evaluating it purely as a new technology.
AI adoption concerns | 2024-2026
Conclusion
The defining insight of 2026 is that supply chain chaos is not a problem to be “solved” once, but a condition to be managed daily. While SMBs have made measurable progress in moving inventory faster and improving service levels, they face persistent headwinds, from rising dead stock to unreliable supplier performance.
Supply chain chaos can feel like a game of whack-a-mole. New problems can surface anywhere across the board, often with little warning. Focusing heavily on one area may sharpen a business’s response in that area while reducing its visibility elsewhere. Better inventory visibility and planning intelligence help teams identify where risk is emerging and respond faster and more accurately. While no single winning playbook emerged from survey responses, the data points to a clear path forward: SMBs that invest in visibility and technology are better equipped to adapt as conditions change.
Overall App Use | 2026
IQR is the interquartile range, i.e., the metric range between the bottom 25% and the top 75%, with the median indicated by the middle line in blue. These quadrants refer to the Filling Orders vs. Stock Turns Behaviors Quadrants introduced in Section 4.
Netstock’s data reinforces this. Customers with both high stock turns and high fill rates also tended to use the platform more heavily. These businesses were moving inventory efficiently while continuing to meet demand, which is the quintessential balance at the heart of effective inventory planning. The relationship is a correlation, not proof that platform use alone produced the result. For lean teams with limited resources, the implication is practical: using supply and demand planning technology consistently, including its AI-powered tools, can help them see changes sooner, choose the right response, and move closer to optimized operations even when the operating environment remains chaotic.
Heading into 2027, agility will matter more than any single tactic. The businesses best positioned for future disruptions will be those that transform changing data into clear, immediate decisions, rather than relying on yesterday’s strategy to navigate today’s reality.
FAQs
These are two different measurements, not a contradiction. Turnover tracks how fast a business is actively moving inventory out through promotions, liquidation, or redistribution, and that’s genuinely getting faster. Dead stock tracks what’s left over that hasn’t moved at all. A business can get much better at clearing the stock it’s actively working to move, while a separate, untouched pile keeps growing. Regular obsolete inventory reviews can catch that stagnant stock before it erodes margins.
Instead of immediately reacting when supply chain disruptions hit, the first thing SMBs need to do is make sure their supply chain and inventory streams are completely visible. Full-spectrum visibility across suppliers, SKUs, and locations allows businesses to respond strategically rather than react, risking unforeseen consequences. A clear-eyed audit, paired with proven supply chain volatility strategies, prevents costly overcorrections that create new inventory imbalances.
Strong performance isn’t one number, but the balance of service levels, inventory turnover rates, and carrying costs tracked together. Reviewing these important inventory KPIs as a whole instead of basing success on a single metric allows SMBs to weigh trade-offs and opportunities that match their supply chain reality.
Supplier timing and lead-time variability are at three-year highs, which has already put long-term pressure on SMBs when it comes to inventory planning. Additionally, in 2026, SMBs reported that lead-time variability was the most prominent roadblock in planning. This lead-time volatility outpaced demand variability, as well as raw material and shipping costs. These challenges impact nearly every aspect of your business: manufacturing, shipping, customer service, warehousing, and more.
Since much of what causes supplier reliability issues is out of an SMB’s control, the most strategic way to confront this challenge is by systematically evaluating supplier performance. Ongoing supplier analysis surfaces which vendors quietly drive up safety stock costs and which vendors are earning a reputation for late or missing deliveries that ripple across the business.
Earlier ordering helps only when paired with accurate demand forecasts. Otherwise, this strategy just shifts carrying costs forward. Leveraging real-time demand forecasts alongside a data-driven, structured ordering approach prevents early orders from becoming early overstock.
From 2025 to 2026, AI shifted from a rush to onboard new tools to a deliberate use of purpose-built technology by 22% of SMBs. Plans for future AI investment rose from 49% in 2025 to 53% in 2026. This growth indicates that the strategic implementation recorded in Netstock’s latest benchmark report is anticipated to continue as SMBs weigh the benefits of AI vs. traditional inventory planning methods and tools.
No. Diversification reduces an SMB’s dependency on a single source, but risks remain. Expanding regional sourcing is helpful when managing supply chain disruptions such as trade wars and natural disasters, but even if regional challenges aren’t your main concern, one truth remains: more suppliers equal more lead times and freight routes to manage. In other words, it adds complexity without reducing exposure. That’s why, regardless of sourcing strategy, true supplier risk management is rooted in full visibility across the whole supplier base. This helps mitigate supply chain risk more effectively than simply adding more vendors.
