Inventory dashboards show what is happening across your business. But understanding why it’s happening, what might happen next and which actions will make the biggest difference requires deeper analysis.
Supply chain planners need to know whether their forecasts are reliable, where working capital is tied up and which inventory decisions deserve attention. Finance teams need evidence of inventory performance, while business leaders need insights that support better decisions.
Netstock combines inventory reporting, advanced forecasting and AI-powered recommendations to help teams investigate performance and identify opportunities for improvement. Here’s how these capabilities help planners move beyond default dashboards and turn inventory data into actionable decisions.
Key takeaways
- Monitor forecast performance: Identify forecast patterns and investigate where demand predictions need attention.
- Measure inventory efficiency: Analyze service levels, inventory turns, excess inventory and slow-moving items.
- Plan for changing demand: Incorporate promotions, events and new products using Netstock’s Demand Planning add-on.
- Prioritize high-value actions: Use AI Opportunities to identify inventory risks and potential financial improvements.
- Share meaningful insights: Use custom reports and supported BI connections to make inventory data more useful across the business.
From monitoring inventory to understanding performance
A dashboard is designed to bring important information to the surface. It can highlight excess inventory, potential stock-outs or changes in service performance, helping planners decide where to focus their attention.
Reporting serves a different purpose. It allows teams to examine data in greater detail, review historical performance, compare results over time and investigate the factors behind an exception.
The distinction matters because the same inventory problem can have different causes. Excess inventory might result from demand falling below forecast, purchasing more than policy recommends or buying ahead of a temporary demand increase. Each situation calls for a different response.
Netstock’s reporting capabilities help planners investigate inventory performance, while Demand Planning supports more detailed forecast analysis and refinement. AI Opportunities adds another layer by identifying potential risks and recommending actions.
Together, these capabilities help teams move beyond monitoring metrics to making better-informed planning decisions.
1. Understand forecast performance and improve demand planning
Forecasts influence purchasing, inventory availability and working capital. When demand predictions consistently differ from actual sales, the consequences can extend well beyond the forecasting process.
Overforecasting can lead to unnecessary purchases and excess inventory. Underforecasting can leave businesses short of the products customers want. Understanding these patterns helps planners determine where forecasting assumptions need attention.
Netstock’s Demand Planning add-on module supports forecast performance monitoring, including measures such as Forecast Bias and Forecast Risk. These provide additional context for reviewing demand forecasts and identifying areas that warrant closer investigation.
Forecast performance analysis is most useful when it informs the next planning cycle. If a product repeatedly performs below forecast after a seasonal peak, for example, the planner can investigate whether the forecast is responding appropriately to changes in demand. The findings can then inform future forecasting decisions.
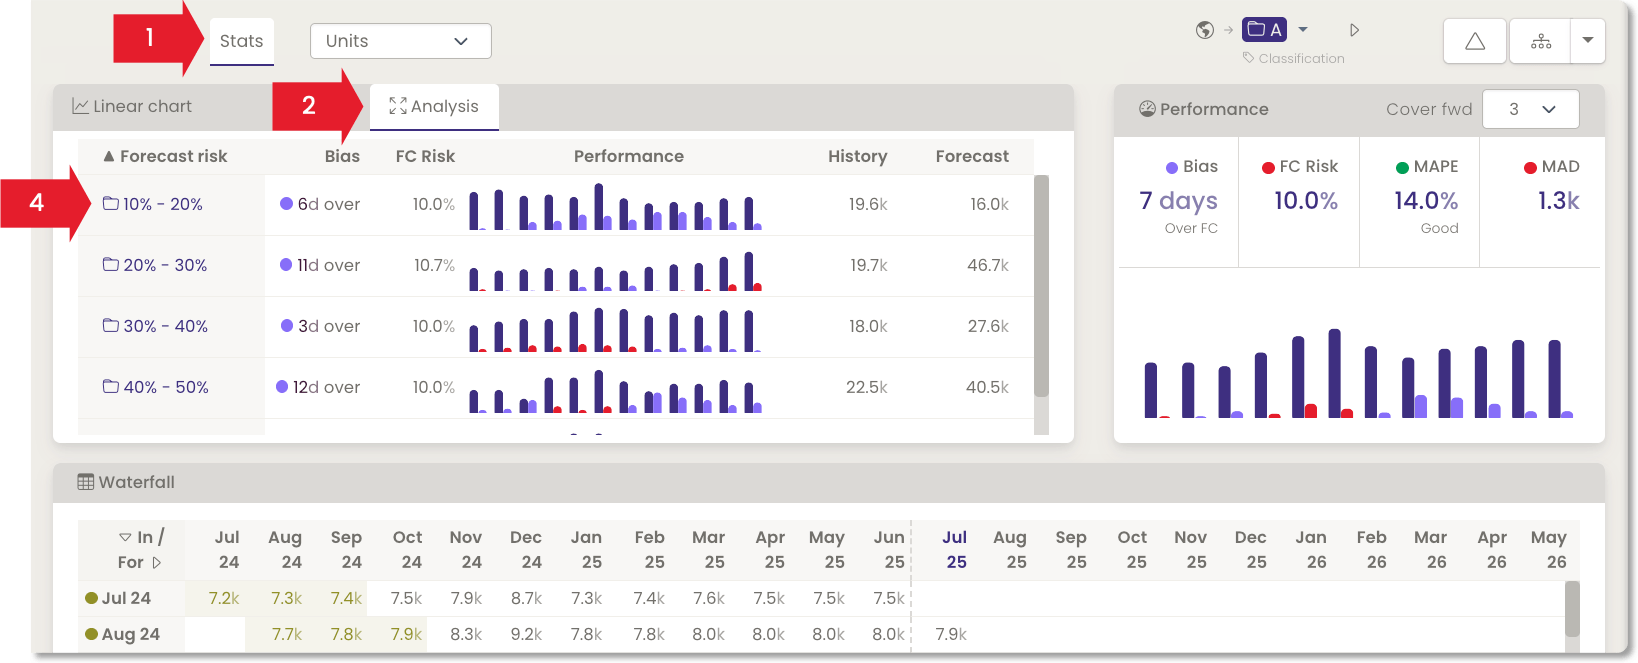
Forecast Analysis View
Refine forecasts using business knowledge
Statistical forecasting provides a starting point, but historical demand cannot account for every future change. Promotions, customer activity, market developments and product lifecycles can all affect expected demand.
Netstock Demand Planning provides a structured way to incorporate this context through three forecast measures:
- Computer forecast: The statistical baseline generated from prepared demand history.
- Working forecast: The forecast as planners refine it using promotions, adjustments, overrides and other available planning tools.
- Final forecast: The approved forecast used for downstream planning throughout the app.
This process allows planners to compare the original statistical forecast with their refined expectations before approving the final version.
For example, a planned promotion may justify a temporary increase in forecast demand. A new product may require a different approach because little or no sales history is available. In both cases, planners can incorporate relevant business knowledge rather than relying solely on historical patterns.
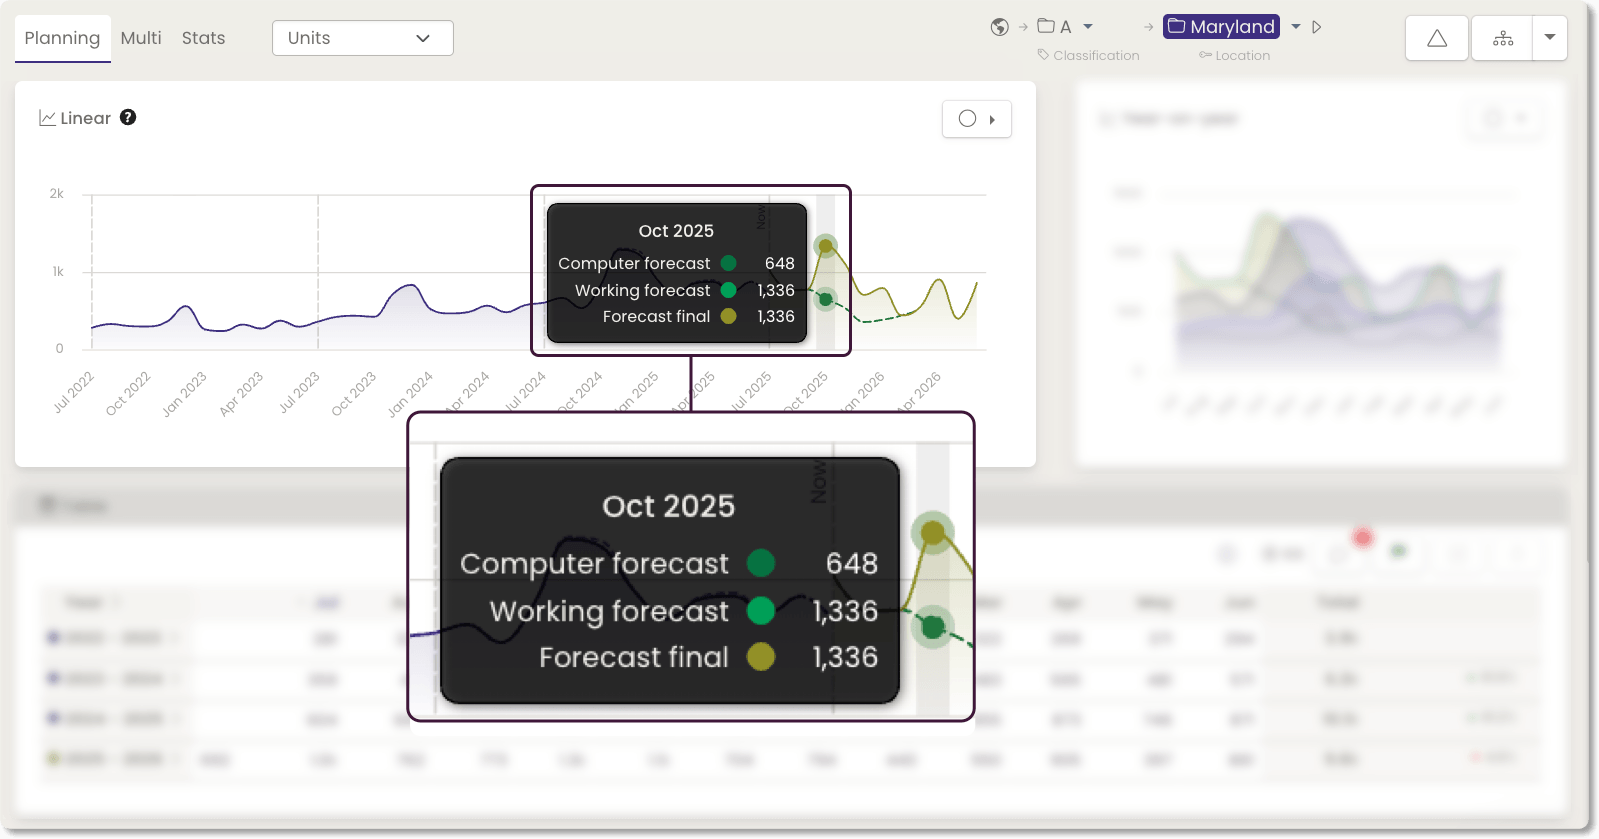
Final forecast example
This combination of statistical forecasting and human judgment helps keep forecasts aligned with expected business conditions as new information becomes available.
2. Analyze inventory efficiency and working capital
Forecast performance is only one part of effective inventory planning. Businesses also need to understand whether their inventory investment is supporting customer service and where capital may be tied up unnecessarily.
Netstock’s dashboards and reports provide visibility into inventory KPIs and the underlying detail needed to investigate performance.
Service levels and fill rates
Service metrics help planners assess whether inventory is available to meet customer demand. A decline in fill rate or an increase in stock-outs may point to issues with forecast assumptions, replenishment settings or supplier reliability.
Reviewing these metrics alongside inventory levels and supply information helps teams investigate the likely causes and determine which corrective actions are appropriate.
Inventory turns and slow-moving items
Inventory turns indicate how frequently inventory is sold or consumed over a defined period. Low turns may warrant investigation, particularly when they coincide with declining demand or increasing excess inventory.
However, a low turn rate isn’t automatically a problem. Some products require higher inventory levels because of long supplier lead times, demand variability or service commitments. The context behind the metric matters as much as the number itself.
Excess inventory and surplus purchasing
Excess inventory can tie up working capital that could be put to better use elsewhere in the business. Surplus purchase orders can add to the problem if incoming quantities exceed expected requirements.
Netstock’s reporting helps planners investigate these issues, identify affected items and review inventory performance across locations.
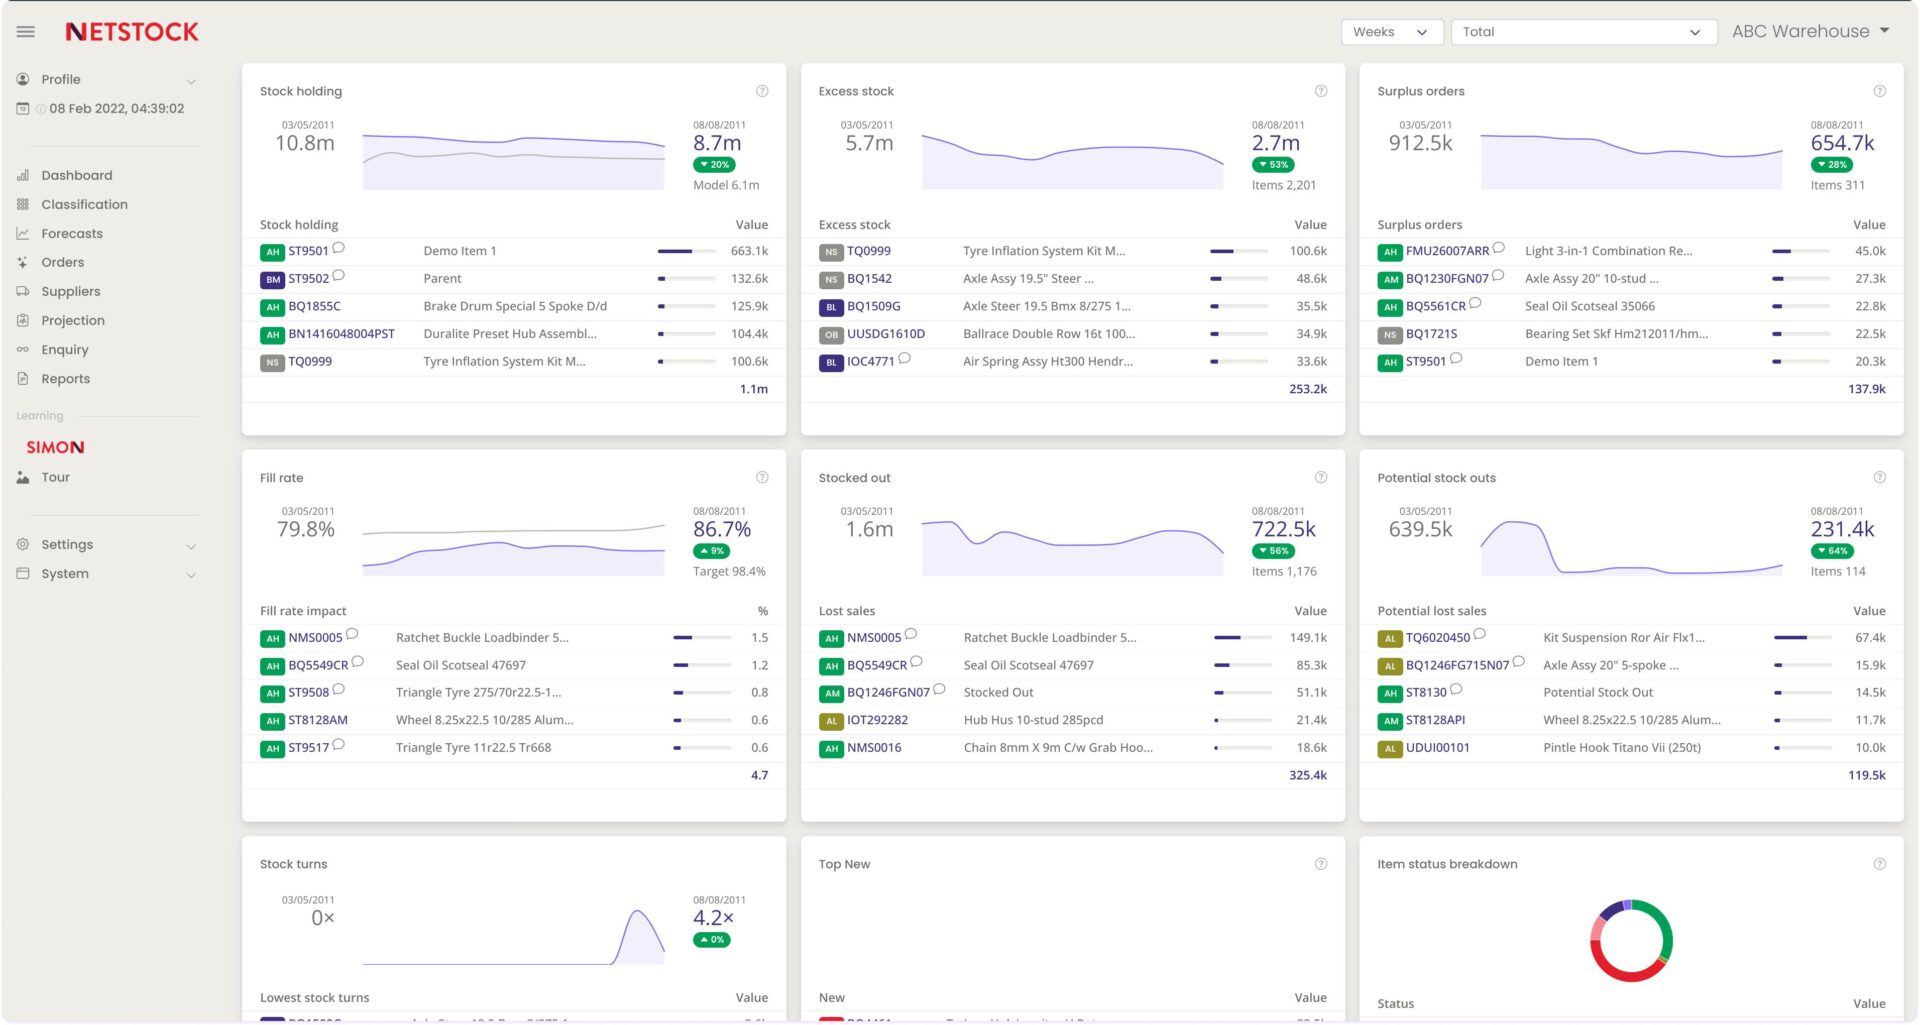
Netstock Reporting Dashboard
The value lies in connecting the numbers to decisions. Once planners understand where excess is accumulating and how demand is changing, they can investigate whether purchasing adjustments, revised forecasts or inventory transfers could improve the situation.
3. Plan for promotions, events and new products
Demand doesn’t always follow the patterns visible in historical sales. Promotional activity can create temporary spikes, events can shift purchasing behavior and new products may have little sales history to support a reliable forecast.
Netstock Demand Planning helps planners refine forecasts to account for these changes.
Forecast Promotions can capture temporary increases or decreases associated with promotional activity. Forecast Adjustments allow planners to increase or decrease expected demand, while Forecast Overrides replace the Working Forecast value for the selected period.
These measures serve different purposes, so choosing the right one helps preserve the reasoning behind the forecast change.
New products require a different kind of planning judgment. Without a reliable sales history, planners may need to draw on information about similar products, expected customer demand or product lifecycle assumptions. Forecast Profiles can also help teams reuse appropriate forecast settings where similar demand behavior applies.
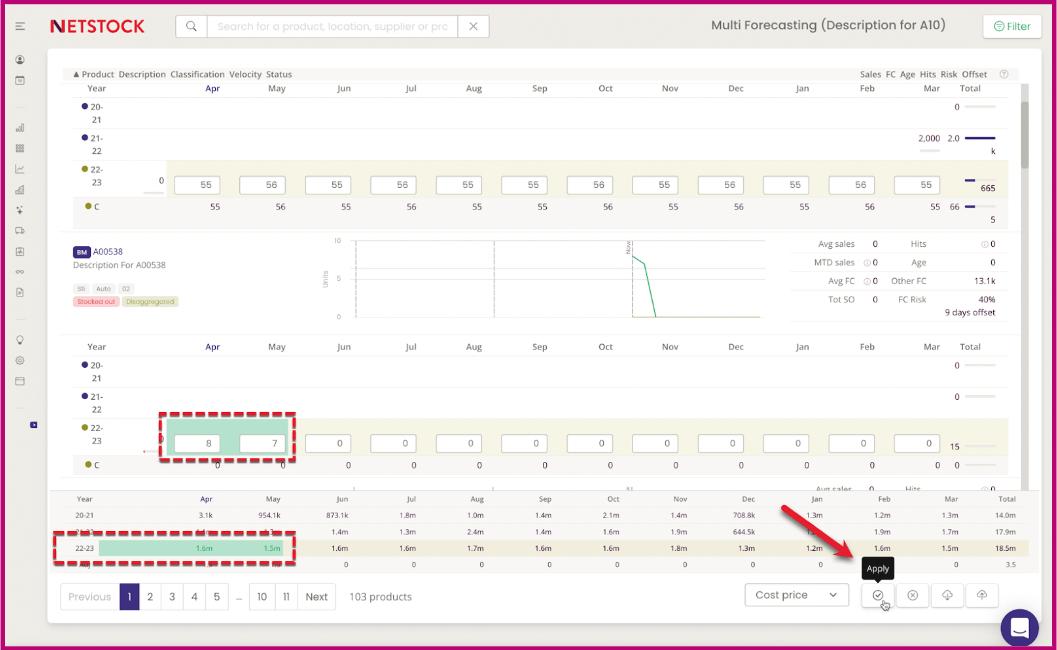
Planning View
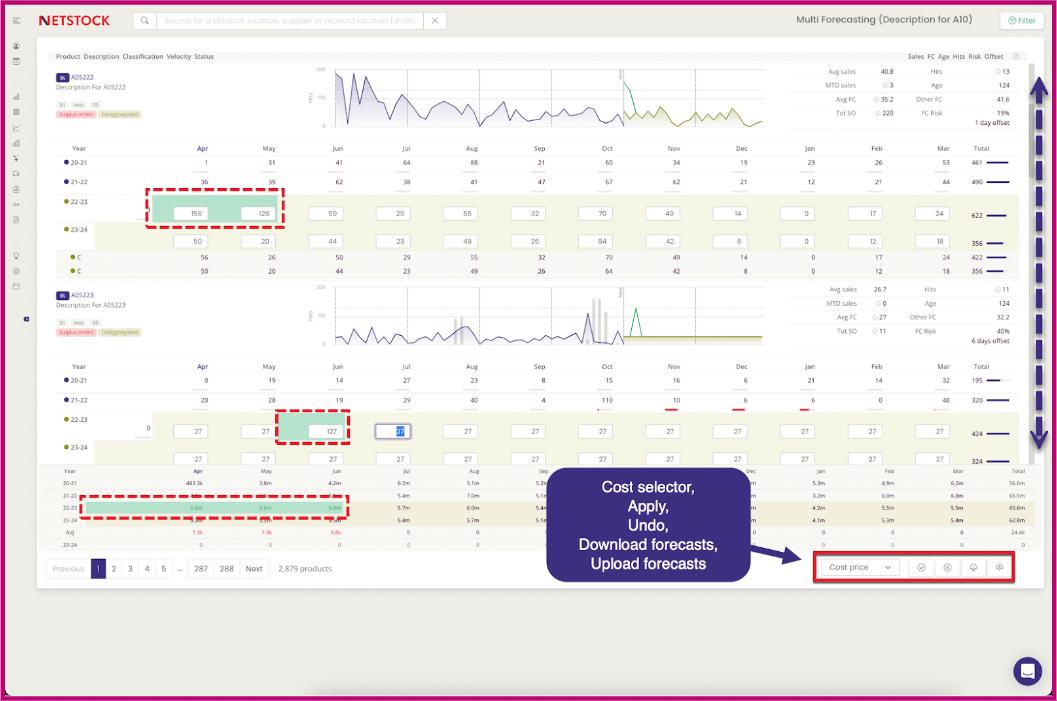
An example of a Temporary Demand Increase
The aim is not to replace statistical forecasting with manual estimates. It’s to give planners a structured way to combine the statistical baseline with business knowledge that the historical data cannot provide on its own.
4. Use AI Opportunities to prioritize inventory actions
Even with detailed reports, planners may have thousands of SKUs across multiple locations to review. Manually identifying every important exception can take time, and opportunities to improve inventory performance may remain hidden in the data.
Netstock’s AI Opportunities analyzes inventory across locations and identifies issues in four areas: potential stock-outs, actual stock-outs, surplus orders and excess inventory. Each opportunity includes a suggested action for the planner to evaluate.
Depending on the situation, that action might involve expediting an order, placing an emergency order, redistributing excess inventory or cancelling, reducing or delaying a surplus purchase order.
This helps planners focus on specific decisions rather than searching through reports to find every issue themselves.
Connect recommendations to financial impact
The potential value of an inventory action can vary considerably. A redistribution opportunity might reduce the need for additional purchasing, while preventing a stock-out could help protect sales and customer service.
Netstock reports that 75% of customers have seen at least one AI Opportunity worth $50,000 or more. This is the value of an identified opportunity, not a guarantee that the full amount will be realized as savings.
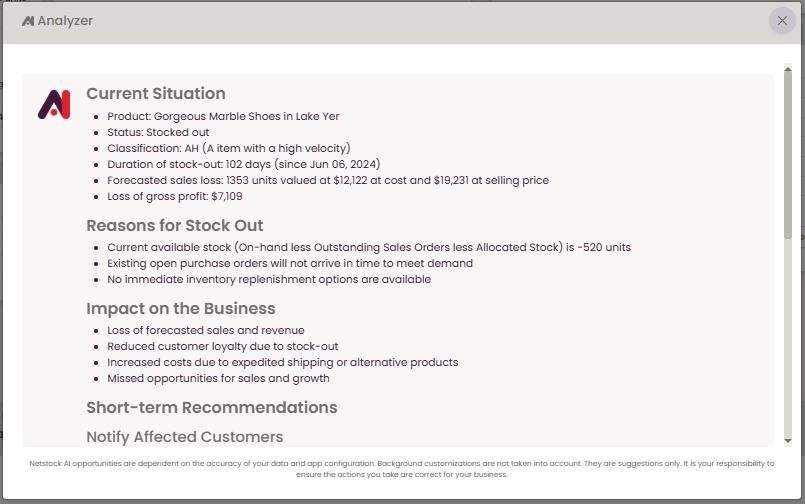
AI Analyzer Recommendation example
Customer example: Distributor Wire & Cable reduces excess inventory by 10%
Distributor Wire & Cable manages nearly 2,000 SKUs across six US distribution centers. With international supplier lead times often exceeding 100 days, the business needs to identify inventory risks early.
Procurement buyer David Pimentel uses Netstock’s dashboard and AI Opportunities to identify issues that need attention, including potential stock-outs, overdue purchase orders and excess inventory that could be transferred between locations.
“It’s not unusual to see opportunities showing $100,000 to $200,000 of excess inventory sitting at one location that could be used elsewhere,” David explains. Without those alerts, the inventory might sit idle for weeks before being discovered in a monthly review.”
The company reports a 10% reduction in excess inventory, alongside improved visibility into inventory risks and faster identification of transfer opportunities.
The example illustrates how AI-powered recommendations can help planners identify actions that might otherwise be missed during manual reviews.
Customer example: Bargreen Ellingson improves inventory performance
Bargreen Ellingson serves the foodservice and hospitality industry through a complex distribution network. Managing inventory across 25 warehouses, three distribution centers and more than 2,000 suppliers makes excess inventory and product availability important operational priorities.
With Netstock, the company reported stockholding reduced from $17.8 million to $9.3 million, more than $2 million in excess inventory eliminated, and a 5% improvement in fill rates for high-turn items. Stock-outs also fell to one-third of previous levels.
These results show how improved inventory visibility and targeted planning actions can contribute to stronger service performance and more efficient use of working capital.
AI doesn’t remove the need for planner judgment. It helps surface relevant opportunities, while planners apply their knowledge of suppliers, customer commitments and operational constraints before deciding what to do.
5. Build reports for deeper analysis and stakeholder visibility
Inventory analysis becomes more useful when teams can examine the right data and share it with the people making purchasing, operational and financial decisions.
Netstock provides standard reports for common planning needs, alongside a Report Builder that allows users to create, save and reuse custom reports by selecting available datasets, fields and filters. Standard table reports can be downloaded as CSV files for further analysis.
For example, a planner might create a recurring report focused on excess inventory within a particular product group. A supply chain manager could review trends across locations, while a finance partner may need inventory data to support a working capital review.
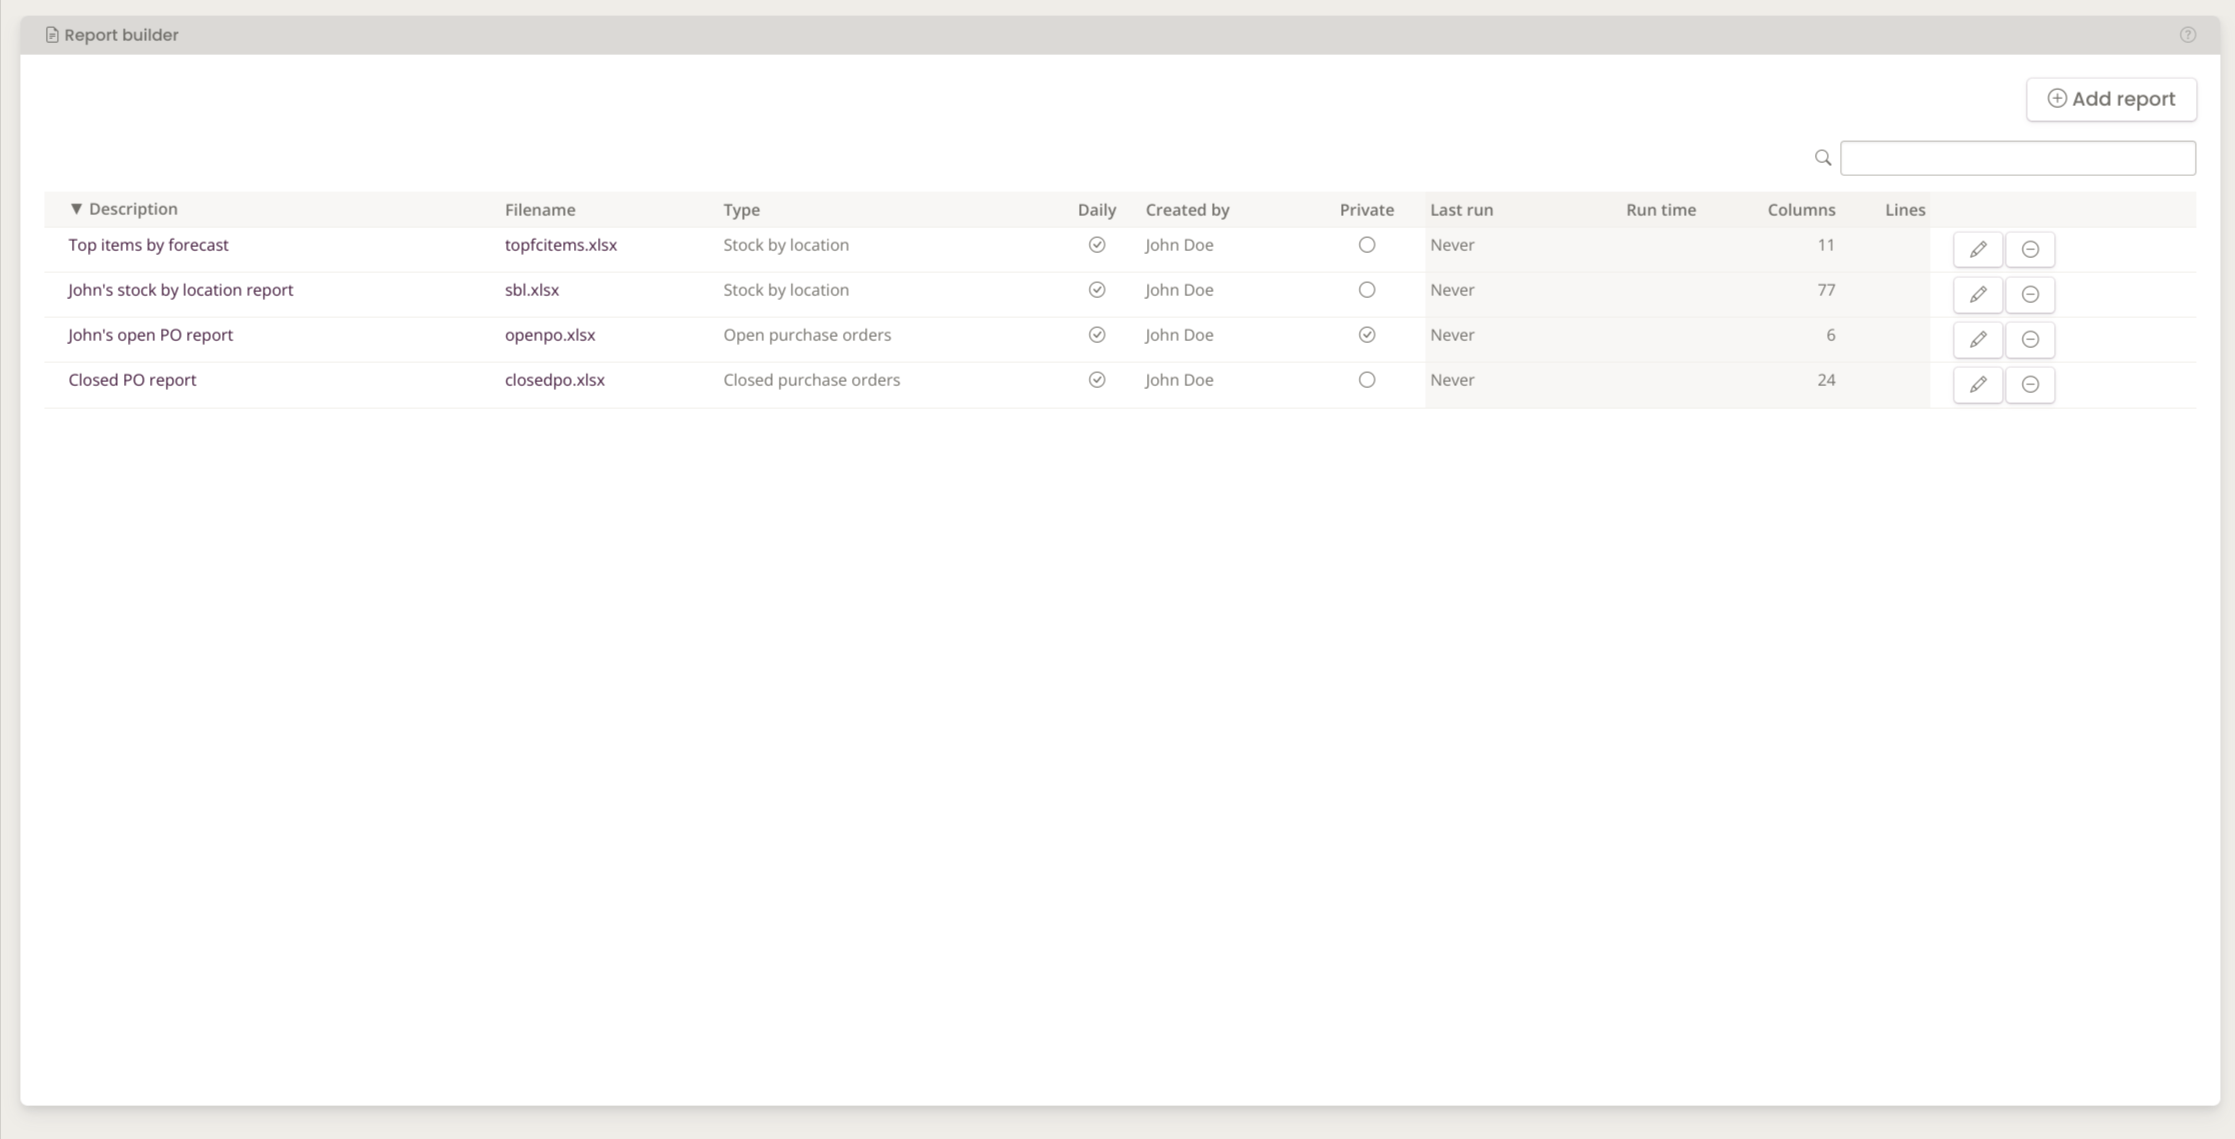
Netstock Report Builder Overview
Netstock also supports data connections to BI tools including Power BI, Tableau and Looker Studio. This allows businesses to bring Netstock data into wider reporting environments and combine it with other business information where appropriate.
The result is a more flexible approach to analysis. Teams can use operational dashboards for immediate priorities, reports for deeper investigation and BI tools for broader business reporting.
Make inventory analytics part of the planning process
Advanced analytics is most valuable when it changes how a business plans. Monitoring forecast performance helps teams learn from past demand. Inventory reporting shows where service performance and working capital need attention. Demand Planning gives planners a way to incorporate business knowledge, while AI Opportunities highlights specific actions worth evaluating.
These capabilities work together to support a continuous planning process: review performance, investigate the causes, refine assumptions and take action.
Customer results from businesses such as Distributor Wire & Cable and Bargreen Ellingson show the potential impact of combining better visibility with focused inventory decisions.
To explore how AI can support everyday planning and replenishment, read AI in inventory replenishment: What small-to-medium businesses need to know.
You can also discover Netstock AI to learn more about the platform’s AI-powered planning capabilities.