More updates to the Netstock app: Forecasting for a location
Forecasting for a location
Month-to-date sales for an overall location are now shown so you can see at a glance how the current month’s sales are performing.
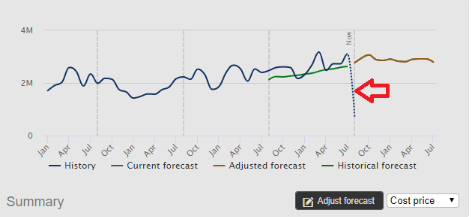
We also made some improvements to the modelling of forecast changes:
- Adjustments to 0% are now correctly represented by the chart
- We’ve improved the visual comparison between the current forecast and adjusted/modelled forecast. If you model a change to a subset of items then look at the entire location, the comparison now looks correct.
Comparing last month’s sales to this month’s forecast
We added a “1 period” comparison to the forecasting page to help you identify and react to the rapidly changing demand in today’s unique market environment.
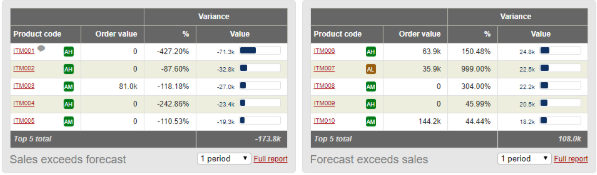
This offers a step between the existing “3 period” comparison and the month-to-date comparison on the dashboard (which is less reliable early in the month).
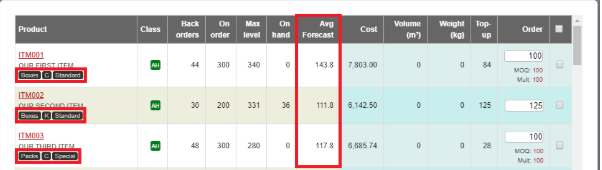
Adding items to an order
Adding an individual item to an order has been made easier. The app now automatically searches based on the text you’ve entered and suggests items to select from.
The page for adding top-up (or all) items to an order now shows your group fields and there is a new column for the average forecast which you can sort to find the fastest moving items. Hovering over the average forecast will reveal the monthly sales history and forecasts.