
Classifying stock items will allow demand planners to focus their efforts and allocate resources on the most significant items in their inventory.
Your customer is key to the success of the business. Making sure you have the right stock on hand to keep up with customer demand is a vital step to get right! There are many moving elements to consider when managing inventory, and let’s not forget the impact of supply chain disruptions and the unpredictable nature of supply and demand. With only so many hours in a day and limited working capital, applying the ABC analysis to your inventory provides a blueprint that allows you to focus on the right items that need attention to ensure your business can consistently meet demand.
In this post we’ll explore:
- Why your business needs to perform an ABC analysis
- How to perform an ABC analysis
- How to identify the cost of each item
- How the classification matrix will help optimize your inventory
- The advantages of an ABC analysis to your inventory
Why your business needs to perform an ABC analysis:
It’s all too common that some businesses choose to proactively manage and review their inventory less frequently than they should, and this leads to two problems:
- When you need to review your inventory, it becomes an extensive, time-consuming exercise that you dread.
- Between the days you review your inventory, there are always challenges, which means you spend your time putting today’s fires out rather than planning for the future
Wouldn’t it be better if you could spend a small amount of time every day managing the few inventory items that matter?
You need to use your time more efficiently: If an alert comes up in your tool stating you’re running out of stock of a particular item- it would be useful to know if that item is critical to your inventory: will it need attention right away or can it wait? Classifying your items can ensure the time and energy you spend on your important items will have the maximum impact, rather than chasing down less important item
You need to use your working capital more efficiently: There’s a lot more to classification than just prioritizing your efforts. Typically, businesses have a limited amount of capital to invest in inventory. Wouldn’t it be good to know that the money you invest will bring you a good return on investment? Furthermore, the money you invest needs to work for your business now, not at some unknown time in the future.
The ABC analysis will classify your items according to their sales and the speed at which they move out of the warehouse. These two exercises combined create a classification matrix that allows you to focus on the stock that contributes the most value to your business.
The ABC analysis classifies your inventory as follows: 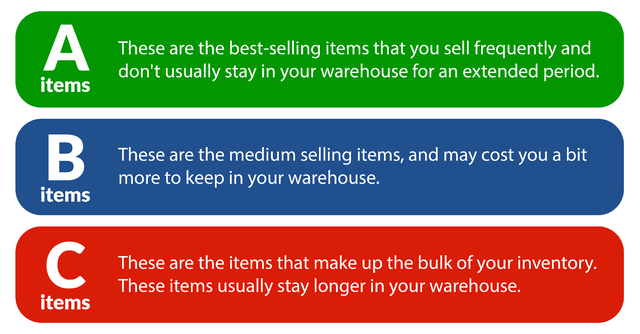
Learn how to perform an ABC analysis by following these few steps:
Step 1: remove obsolete items
Obsolete items are the items that you never plan to stock. You may have stocked them in the past, but you’re not going to stock them again. You may have a manual indicator that you can use to remove obsolete items, or you can go with a rule-based approach.
A practical example to identify obsolete items: Review all items that have been in your warehouse for 24 months or longer, and then mark the items that have not sold during the last 24 months as obsolete in your system.
If you are still carrying stock in the warehouse of these obsolete items, we recommend that you get rid of that stock quickly by either:
- Selling these items at a relatively reduced price.
- Offering a “buy two get one free” special.
- Consider adding these items as a “free giveaway” as part of another product item for which you want to generate more sales.
Obsolete items are also considered excess stock, and if you continue to stock these items, you will incur additional hidden costs by storing these items in your warehouse.
Step 2: remove non-stocked items
A non-stocked item is an item you keep on your price list but not in the warehouse. If a customer orders these items, you order directly from the supplier and supply them to the customer. Typically, these are slower-moving items that the customer cannot easily purchase elsewhere and are willing to wait for them.
A practical example to identify non-stocked items: Review all items that have been in the system for 12 months or longer and select the items that have sold in three months or less as your non-stocked items.
From now on, you will only order these non-stocked items when a customer orders them.
Step 3: start classifying your stock items
Now that we’ve identified your obsolete and non-stocked items, you are left with all the items that regularly sell: your stocked items. These are the items you want to work with to create our inventory classifications.
To implement an effective ABC classification, you must take two things into account:
- Value: the cost of the item.
- Velocity: how fast the item moves out of your warehouse.
How to identify the cost of each item
Identifying the cost of each item should be an easy step as you will already have the average or latest cost in your ERP system. Use that field. You can then review the previous 12 months of sales and determine the average monthly sales for each item to determine how fast they move. However, if you have a future sales forecast, that’s a better indicator to use. You don’t want to mark an item as a slow-moving item when its sales are trending upwards, and in 6 months, that item might be a top-seller. Similarly, you don’t want to mark an item as a fast-moving item when its sales have dried up, and there won’t be any demand for that item in six months. Think of a discontinued product line, for example. Using your forecasted sales should always be your first option, where possible.
Identifying how fast each item moves from the warehouse.
Let’s practically apply the 80/20 rule to your stocked items. When referring to inventory, the 80/20 rule, also known as the Pareto principle, suggests that 20% of stocked items will make up 80% of your sales. This means – if you need to focus on the 20% of items- you need to know which are those stocked items!
Start by creating a new column in your spreadsheet for every item with this simple formula:
(item’s cost price) x (historical or forecasted average demand)
- Once you have calculated that formula above for every item, you can calculate the total of that net column.
- Next, sort the items by that new column from highest to lowest. Start at the top and accumulate the new column. Once you get to 80% of the total, draw a line and call those items A items.
- Continue with that until you accumulate 96%. Draw a line and call those items B items. You might be thinking, ‘ why 96%?’ Because that’s the original 80% and 80% of the remaining 20% – a re-application of the 80/20 rule to the non-A items.
- Then, mark the rest of the items as C items.
What you’ll notice is that only 20% of the number of items are marked as A.
That’s the Pareto principle in action!
What about classifying your items according to High, Medium, and Low [HML]?
You’ve now learned how to apply the ABC analysis to your inventory, but sometimes you have some essential items that will fall into the C category [your slow-moving items]. That means we have to address the classification from another angle.
A practical example: In a typical electronics shop, they sell expensive smartphones ( A items), but they also sell very inexpensive screen protectors for those smartphones (C items). Since it’s such a competitive market today, if a customer comes into your shop to buy a smartphone, but you can’t sell them the $2 screen protector they were also looking for, the customer could go to a competitor to get the entire purchase. That’s a huge loss of revenue for something that probably costs pennies!
The solution is to classify items by the velocity or the speed they move through the warehouse.
Further categorizing your stock by velocity is a reasonably simple exercise.
All you need to do is:
- Repeat the steps from the ABC analysis above, but don’t use the cost price. This time, use only the average demand.
- Instead of ABC, you may want to call these High, Medium, and Low-velocity items. [HML]
Suddenly your screen protectors for those smartphones are classified as high-velocity, and you’ll give them the attention they deserve.

Applying the classification matrix to help optimize your inventory.
What we have now are two competing methods of classification: the ABC and HML. It now becomes challenging to apply both classification methods for each SKU. The solution is to combine the two classifications into a matrix.
We can have ABC down the side of the matrix, and HML across the top, like in the diagram below.
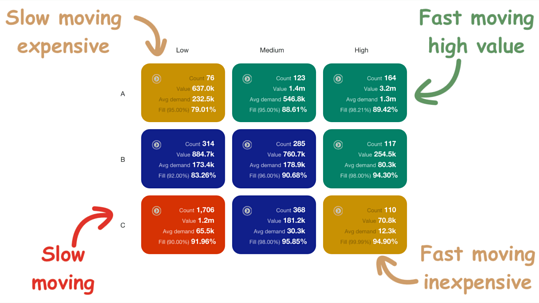
- Green blocks: These items contribute the most to your sales and where you will spend most of your resources.
- Red block: Are the Items that don’t contribute a lot towards your sales.
- Brown blocks: These represent specialty items that require different planning.
Using this classification matrix, you now have visibility of how your items are classified. You can immediately see that the green blocks (AM, AH, and BH) are your business’s “bread and butter” items. You need to keep a close eye on those items, ensuring you don’t run out and experience stock-outs. If you do, you will lose a sale and potentially jeopardize your relationship with your customer.
On the other hand, the CL items are just ‘noise’ in your business. They rarely sell, and when they do, they don’t make your business much money. You may even consider downsizing those product lines.
The two brown blocks are interesting. The AL items don’t sell often, but they make a lot of profit when they do sell. Think of a motor vehicle tire outlet: The Porsche tires are in the AL corner. You won’t sell them every day, but when you do, you make a good profit. Meanwhile, the Toyota Corolla tires are probably in the AH corner.
On the opposite side of the classification matrix, is the CH items. These are the smartphone screen protectors. They don’t make much profit, but they sell often, and are used as loss-leaders. According to smallbiz.com,”a loss leader is a pricing strategy where a product is sold at a price below its market cost to stimulate other sales of more profitable goods or services.”
The advantages of an ABC analysis to your inventory:
- Reduction of excess stock, which also incurs additional inventory costs for your business.
- Reduce stock-outs and meet demand.
- Improve forecasting since the items will be categorized by demand. This will help to forecast demand.
- Improve your customer service levels.
Netstock customer story: Tempcon Instrumentation Ltd, previously managed over 4,000 SKUs manually.
Using the Netstock classification matrix, we quickly discovered that there were less than a hundred high-value, high-volume items that we should focus on – Steve Copeland, Director at Tempcon.
They were also able to identify the low-value, yet fast-moving items that they were not ordering enough of. Steve continued to point out that,
Our stock turns were incredibly high, and considering the time and effort spent when a shipment arrives, it made more sense, for the sake of a few thousand pounds, to order more quantity and avoid the stress of managing back orders.
Invest in inventory management software to automatically classify your inventory.
When you manage hundreds or even thousands of SKUs (stock keeping units), using a manual tool such as spreadsheets to classify and manage your inventory, will place your business at risk. Spreadsheets are prone to human error and you have to spend many unnecessary hours trying to find and fix any errors.
Ask yourself: Does your inventory tool automatically classify your items allowing you to generate optimal inventory orders?