NETSTOCK’S SOLUTIONS

Introducing Netstock’s AI Pack
Netstock’s AI tools help solve specific problems and generate better results - making inventory management faster and easier. With one click, you get an AI expert who collaborates daily to identify and resolve issues, providing actionable recommendations - saving you time to focus on what matters.
Learn more about Netstock AI

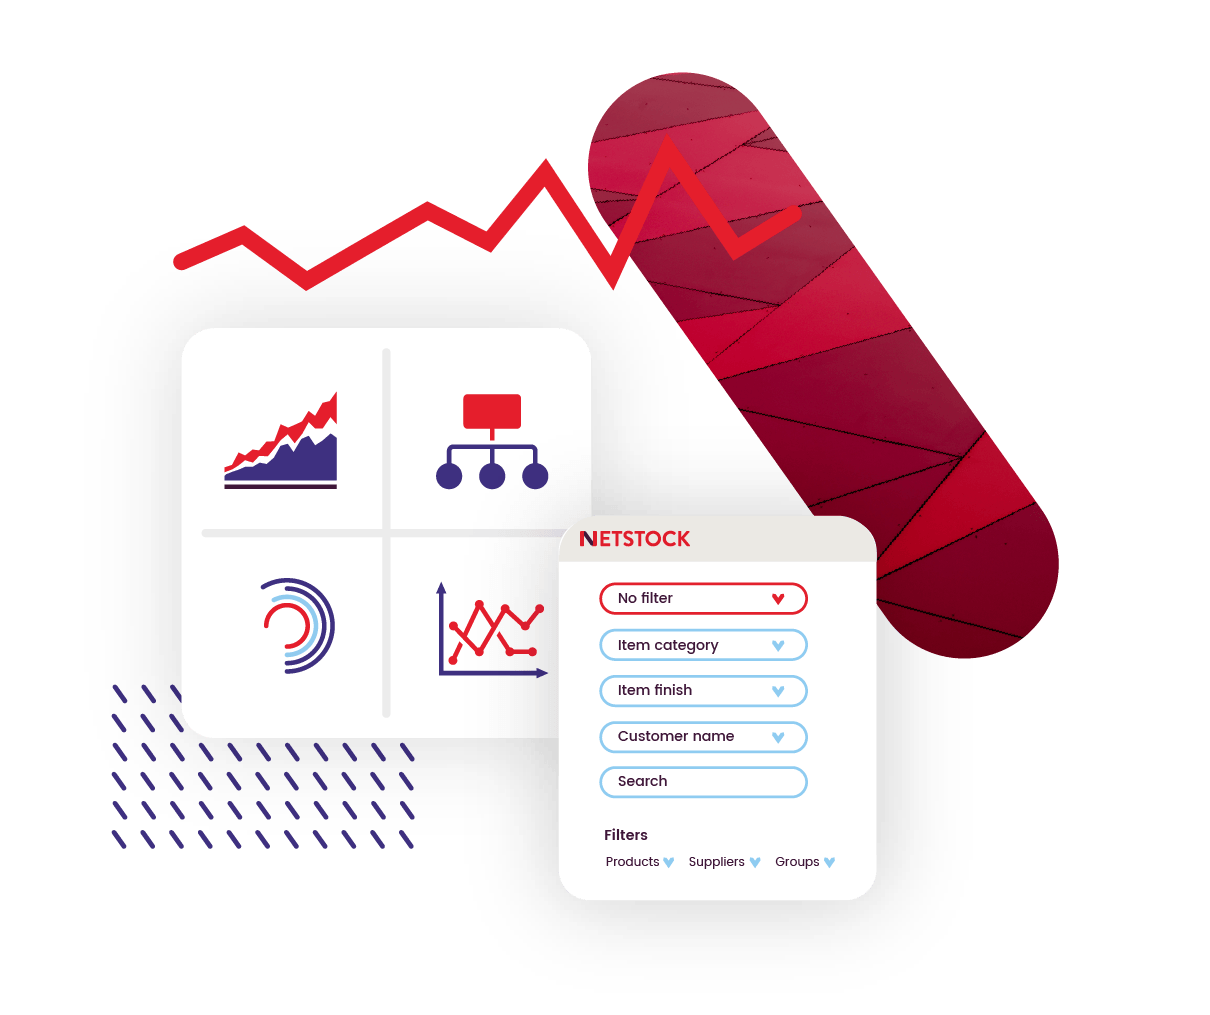
Supply and demand planning with Netstock
Managing inventory shouldn’t feel like guesswork. With Netstock, you get innovative tools to effortlessly balance your inventory investment—cut down on excess stock, free up cash flow, manage capacity, and never miss a sale due to stock-outs.
Everything you need to out plan unpredictability.
Nestock Predictor IA: Optimize inventory planning
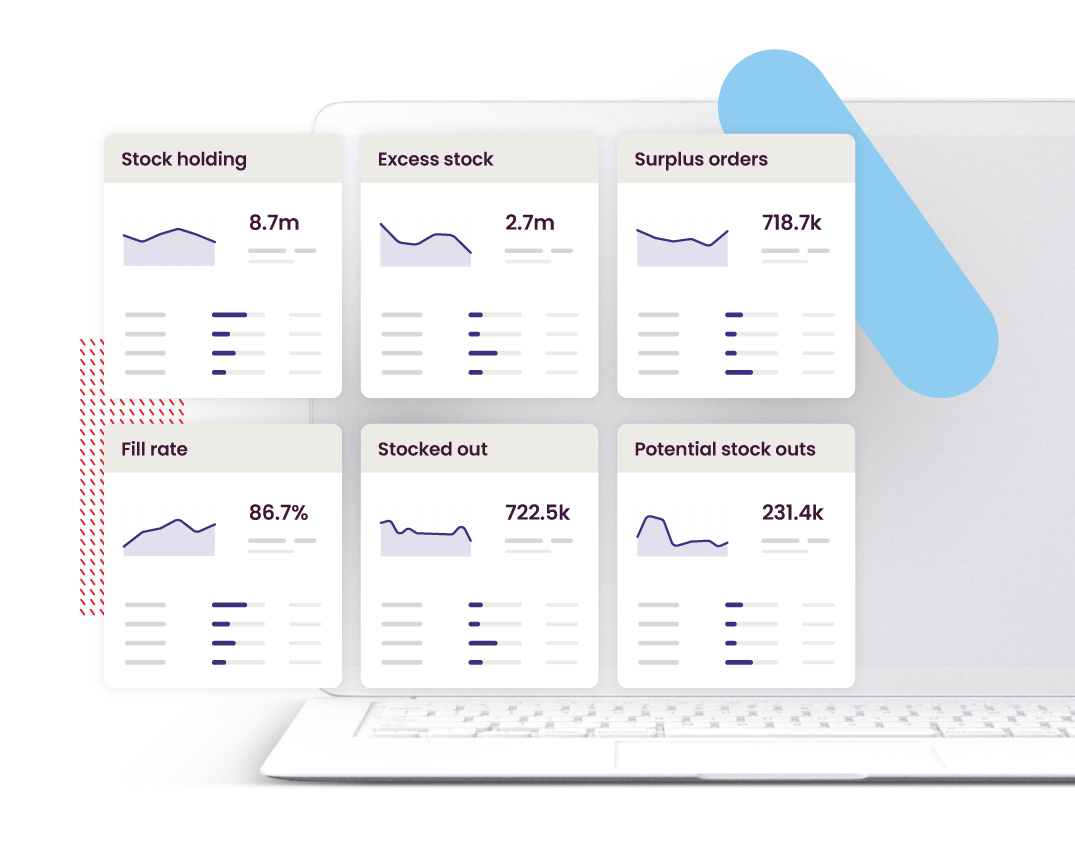
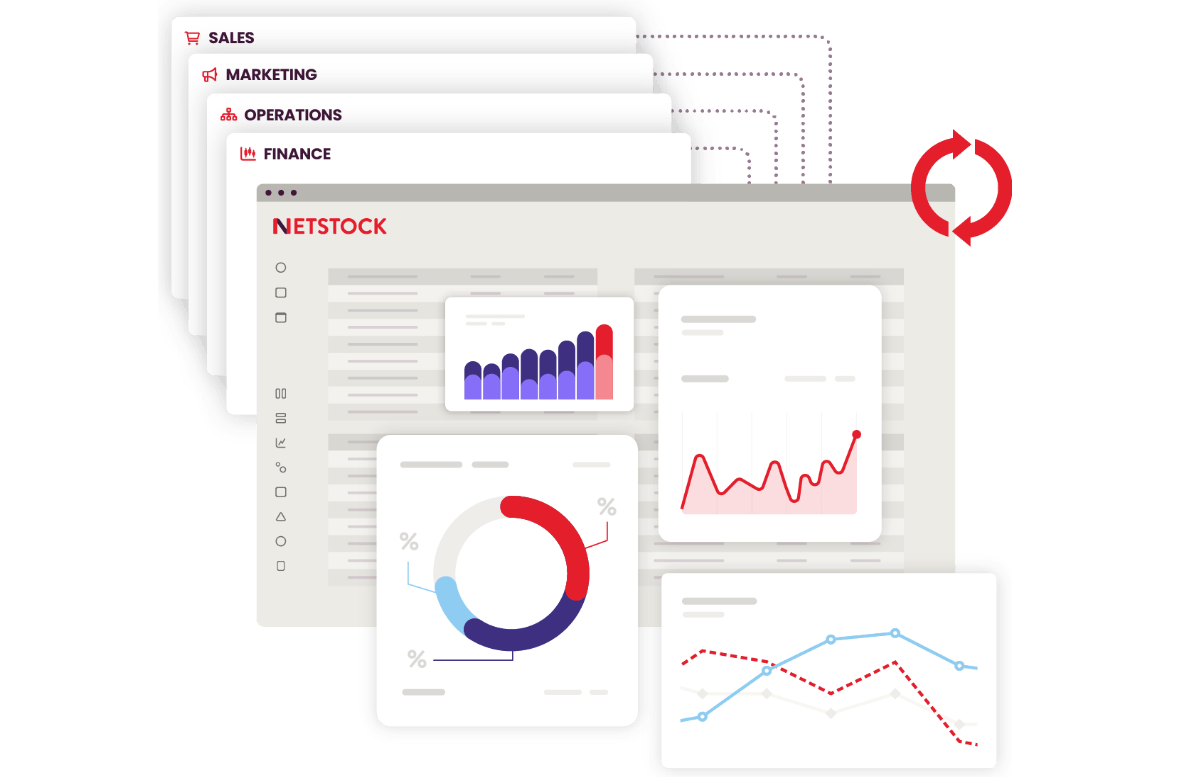
Increased visibility
See all your inventory KPIs – stock vs. model stock, fill rates, stock-outs, and excess stock in one visual dashboard. Early warning signs will highlight items needing attention so you can quickly adjust your planning in response to changes in supply and demand.
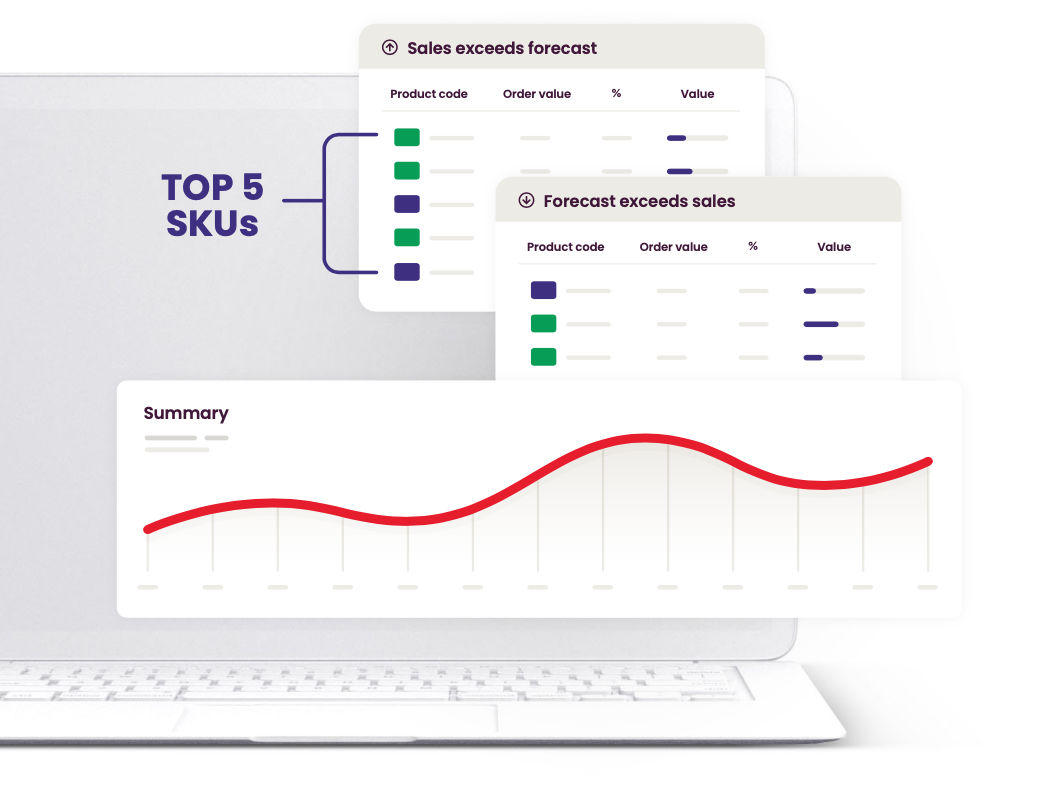
Forecasting
Build better forecasts that leverage historical data and predictive forecasting, fueling automated planning to capture your full sales potential. Forecast by product, channel, and location and automatically create high-quality forecasts that factor in seasonality and trends. Easily assess overall results and loop in sales, marketing, and senior management.
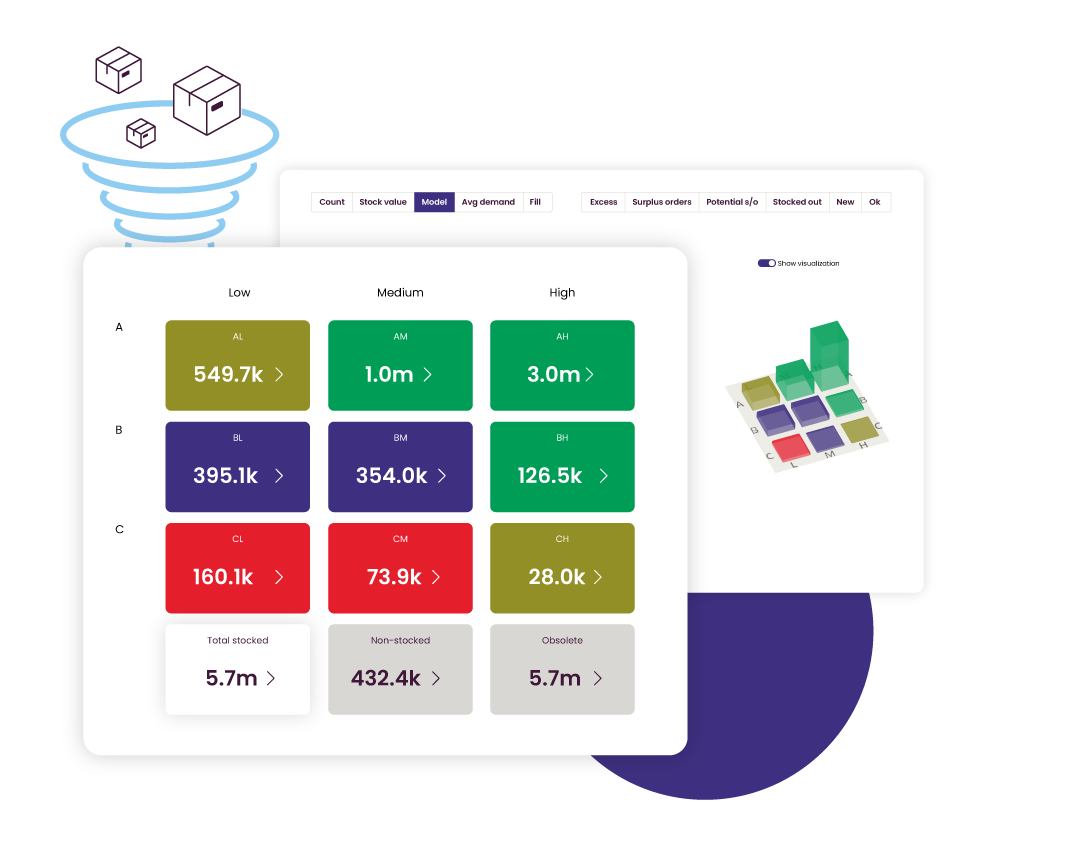
Inventory classification
Automatically classify every SKU according to historical sales data & velocity to focus your time and resources on what’s critical to meet demand. Invest in high-performing, profitable products and reduce overstocking of the wrong products.
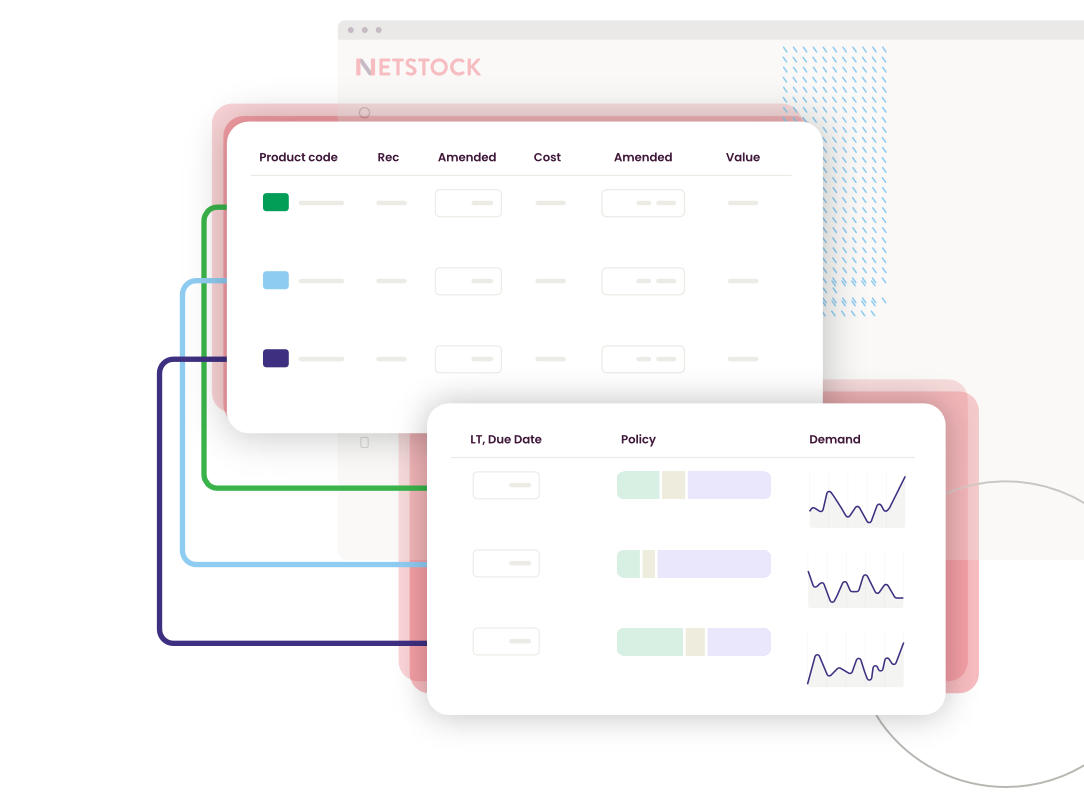
Inventory orders
Enable faster replenishment with predictive orders and automatically generate balanced and optimized orders for each SKU based on predictive models that leverage historical data to anticipate changes in demand and supply. The recommended order schedule drives every order with the goal of achieving the most balanced, optimal inventory holding.
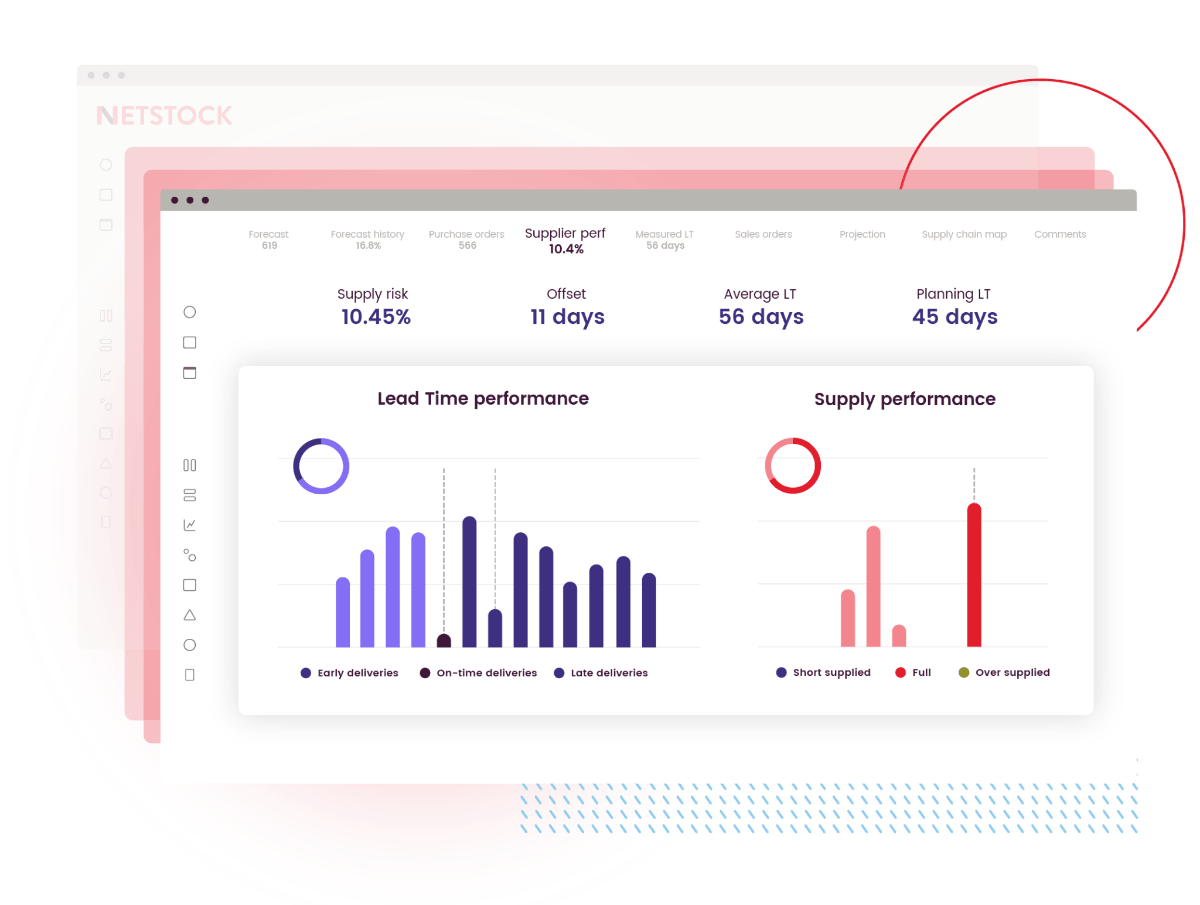
Supplier performance
Work with suppliers to reduce lead times and improve customer service levels. Using supplier data, Netstock can automatically compute lead times and adjust safety stock per item according to the supplier’s risk profile. Netstock will also highlight poorly performing suppliers so you can take action and optimize your supplier network.
Netstock Predictor IBP: Enhance demand & capacity planning
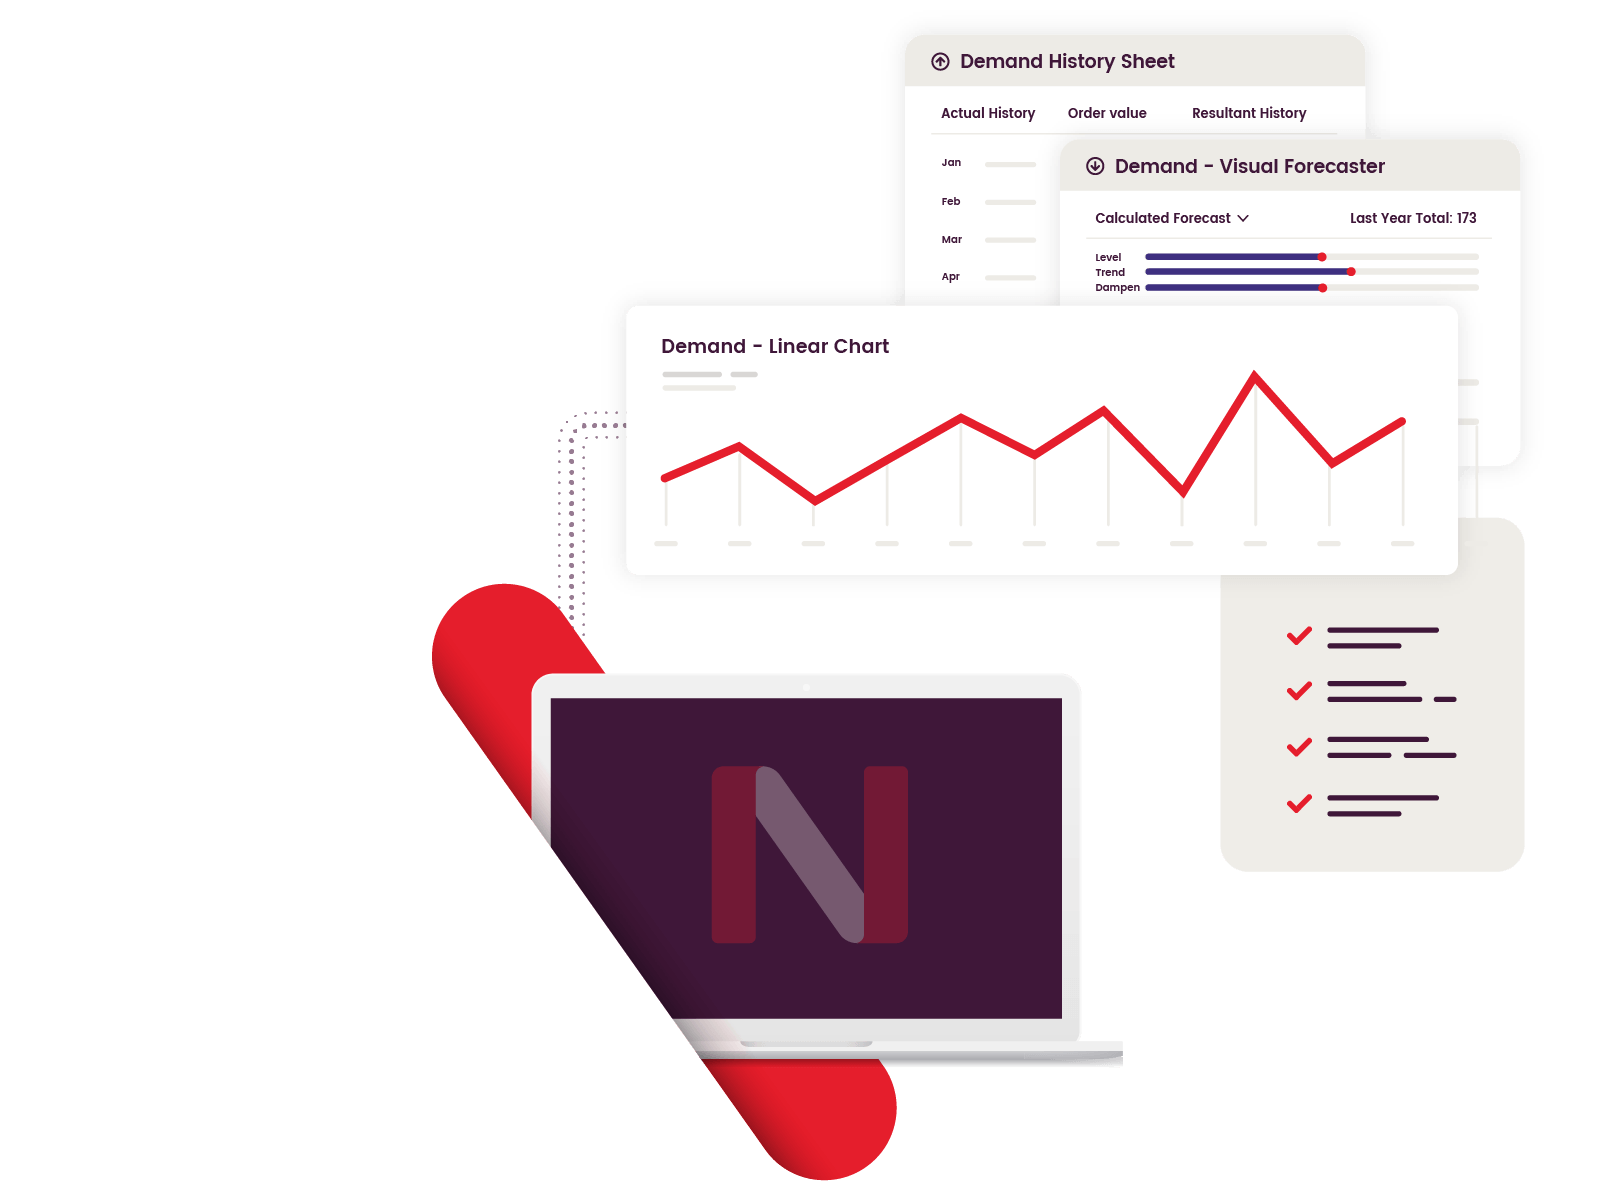
Demand planning
Our powerful forecasting engine uses machine learning and predictive analytics to help you understand how marketing, promotions, and other events will impact demand. You can confidently plan for new products, seasonal trends, and special events with more accurate forecasts.Pivot Forecasting® is a unique technology that enables you to forecast at any level with mixed product, channel, customer, and geographic hierarchies.
Inventory planning & optimization
Optimize stocking levels and efficiently replenish inventories while improving customer service and cost by leveraging predictive analytics tools. Netstock plans inventories through multi-tiered distribution channels with multilevel formulations or bills of material and complies with ordering constraints such as MOQs, vehicle loading, lot sizes, and lot expiration dates.
Sales & operations planning
Bring your entire team—supply chain, sales, marketing, procurement, operations, and finance—onto the same page with integrated sales & operations planning (S&OP). Share financial goals and strategies in one centralized place for better visibility and collaboration across departments. With built-in functionality to align sales forecasts with inventory and operations, your finance team can use predictive planning to prepare for future outcomes, spot trends, and validate their forecasts with advanced analytics tools.
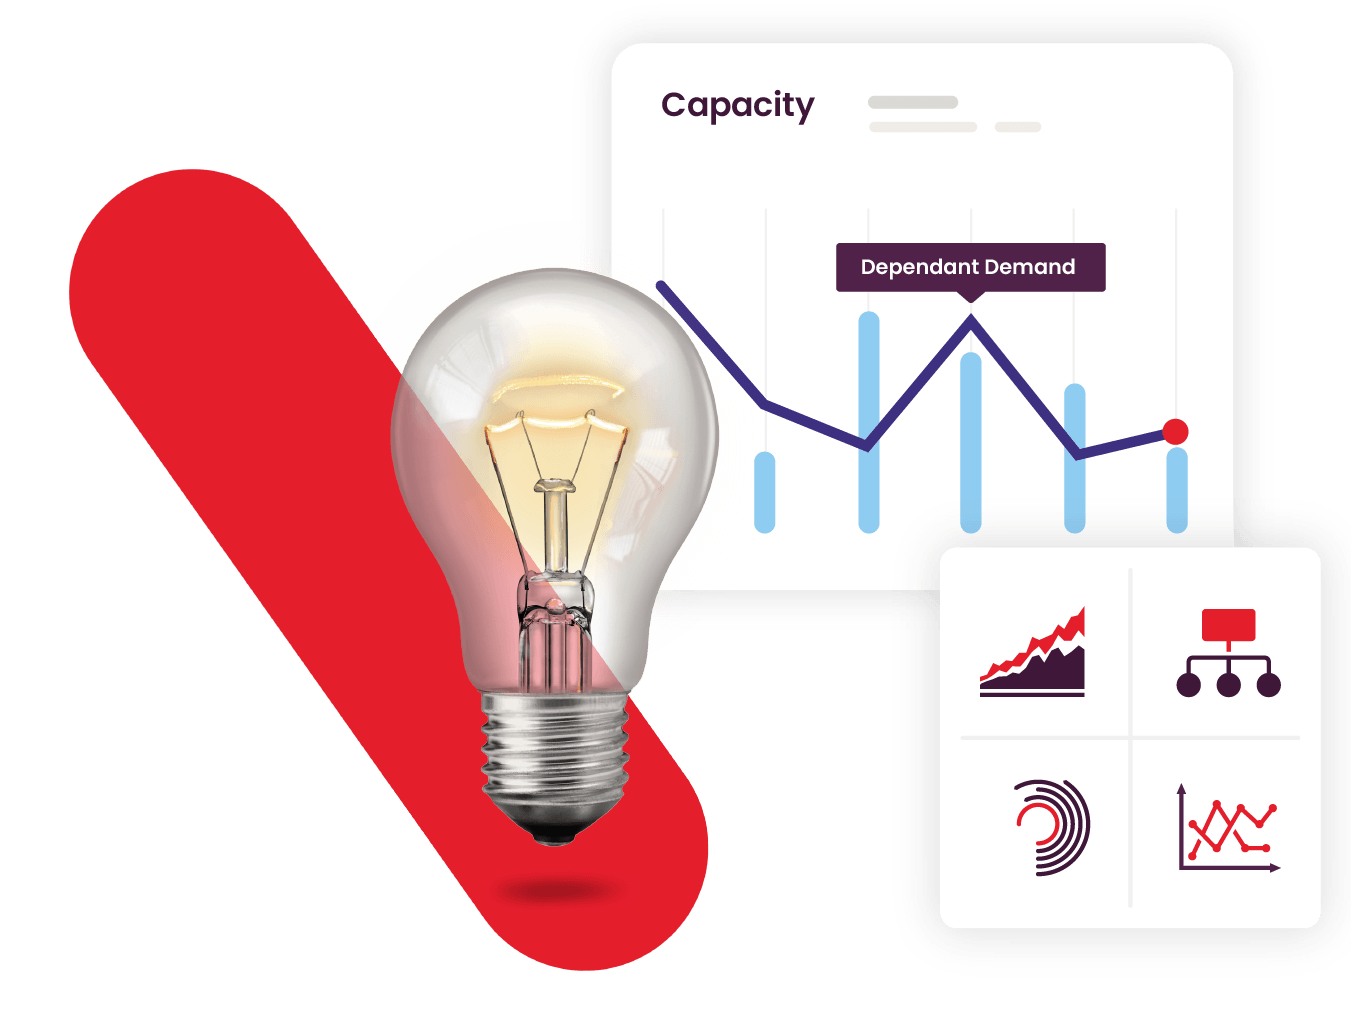
Capacity planning
Produce time-phased production and procurement plans and solve optimal material-resource-time assignments using predictive modeling. The optional Finite Capacity Planning will suggest strategic inventories when appropriate and automatically spread material requirements across resources or vendors to optimize cost and throughput, preparing your business for seasonal peaks, planned outages, or rapid growth.

A proven onboarding process with ongoing support
Your dedicated team of Netstock experts will provide a customized implementation and onboarding plan, enabling your team to quickly experience the benefits of Netstock. After onboarding, you will continue to receive ongoing customer support and training.
Learn More
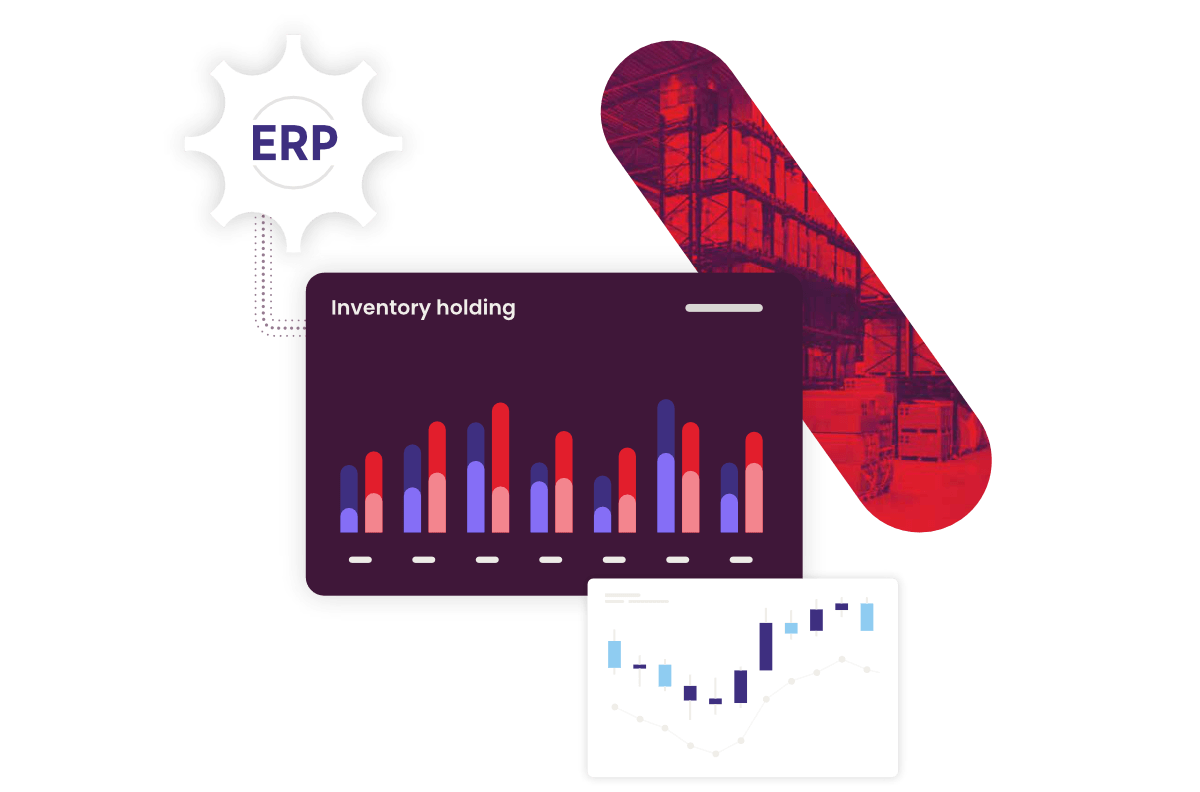
Netstock enhances data in your ERP
Netstock integrates with leading ERP systems, automatically processing data to rapidly deliver smart supply chain recommendations.


FAQs about demand and supply planning
Demand and supply planning is the process of forecasting customer demand and aligning inventory, production, and supply chain operations accordingly. Advanced software solutions, like Netstock, use AI and predictive analytics to generate accurate forecasts, optimize stock levels, and reduce waste—helping businesses make data-driven decisions and improve efficiency.
Predictive modeling software uses historical data, machine learning, and statistical algorithms to identify patterns and forecast future outcomes. Businesses use it for demand forecasting, risk assessment, customer insights, and operational efficiency. By leveraging predictive analytics, companies can make smarter decisions, minimize risks, and gain a competitive edge.
The best predictive model depends on your data, industry, and specific needs. Common models include linear regression, time series forecasting, decision trees, and neural networks. Advanced AI-driven solutions often use a combination of models to enhance accuracy. The key is selecting a model that aligns with your business goals and continuously optimizing it based on new data.