If you’re not measuring your inventory performance, you’re guessing, and that’s risky business.
Key Performance Indicators (KPIs)are your inventory dashboard. They give you real-time visibility into what’s working, what’s not, and where to take action. From avoiding stock-outs to optimizing holding, they help you make smarter, faster decisions.
Smart inventory planners stay on top of their inventory KPIs to keep stock levels right-sized and customers satisfied.
As Multichannel Merchant notes, “Today’s shopper wants visibility into the entire order fulfillment process, from accurate availability at purchase to tracking information during shipment. Fulfillment visibility is no longer a nice-to-have but a must-to-compete in ecommerce and improve your bottom line.”
Thankfully, getting started with inventory performance metrics is easy.
Key takeaways
- Identifying key inventory performance metrics is key to successful inventory planners and businesses.
- The core five inventory KPIs all planners should track are inventory turnover ratio, fill rate, demand forecasting accuracy, stock-out rate, and days of inventory outstanding (DIO).
- Planners can start tracking inventory KPIs in 4 simple steps.
- Inventory management software, like Netstock, streamlines KPI tracking for increased accuracy.
What are inventory KPIs?
Inventory Key Performance Indicators are measurable metrics that track how well you manage stock levels, meet demand, and run your supply chain.They give you the data you need to optimize purchasing, reduce carrying costs, and boost customer satisfaction.Knowing which inventory KPIs matter and how to act on them, is a must-have skill for any planner looking to improve performance.
The top 5 inventory metrics every planner should track
What are some of the critical inventory management KPI’s for your supply chain, and how do they affect your inventory holding?
As an inventory planner, you’ll know that the supply chain is in flux, and it has become crucial to set the necessary inventory KPIs to help you make decisions for your business, improve inventory forecasting, and make sure you serve your customers on time and in full. If you haven’t set these yet, you’re reading the right article!
These 5 essential inventory performance metrics provide the foundation for effective inventory management.
1. Inventory turnover ratio
- Formula: Cost of Goods Sold ÷ Average Inventory Value
- Benchmark: 4-6x annually (varies by industry)
- Why planners need it: This metric reveals how efficiently you’re converting inventory into sales. Low turnover indicates excess stock or slow-moving items, while high turnover may signal potential stock-outs.
- Planner action: Use turnover data to adjust reorder points and identify which SKUs need demand planning attention.
2. Fill rate (service level)
- Formula: (Orders Fulfilled Completely ÷ Total Orders) × 100
- Benchmark: 95-98% for most industries
- Why planners need it: Fill rate directly measures your ability to meet customer demand from existing stock. It’s the most critical metric for maintaining customer satisfaction.
- Planner action: Monitor fill rates by SKU and customer segment to prioritize which items need safety stock adjustments.
3. Demand forecast accuracy
- Formula: (1 – |Actual Demand – Forecast| ÷ Actual Demand) × 100
- Benchmark: 80-95% accuracy target
- Why planners need it: Forecast accuracy directly impacts every other inventory metric. Poor forecasting leads to stock-outs or excess inventory.
- Planner action: Review forecast accuracy weekly for high-impact SKUs and adjust forecasting models based on patterns.
4. Days of Inventory Outstanding (DIO)
- Formula: (Average Inventory Value ÷ Daily Cost of Goods Sold)
- Benchmark: 30-90 days depending on industry
- Why planners need it: DIO shows how long your current inventory will last at current sales rates. It helps balance cash flow with service levels.
- Planner action: Use DIO to identify items with excessive coverage and optimize reorder quantities.
5. Stock-out rate
- Formula: (Number of stock-outs ÷ Total SKUs) × 100
- Benchmark: Less than 2-5% depending on industry
- Why planners need it: Stock-outs directly impact customer satisfaction and lost sales. This metric helps you identify systematic issues in your planning process.
- Planner action: Analyze stock-out patterns to identify common causes (supplier delays, demand spikes, forecasting errors) and adjust safety stock accordingly.
How inventory planners should implement these metrics
Step 1: Understand your inventory
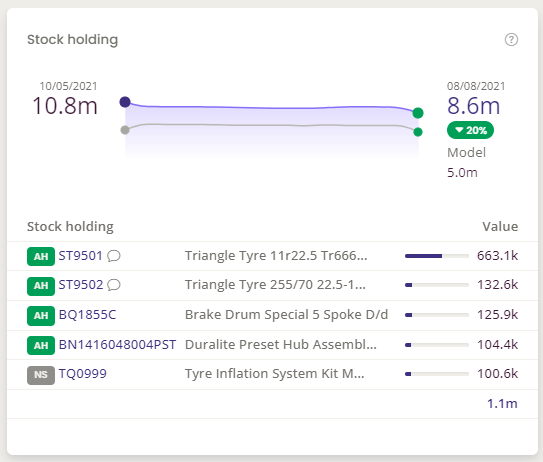
To begin, you will want to have a general understanding of your inventory holdings. When you start looking at your inventory, you need to know the value of your inventory holding in your business relative to how much excess stock you have.
Ask yourself, “Is the value of your inventory holding increasing or decreasing?”
In this phase, it’s also vital to classify your items by looking at each item’s value and velocity.
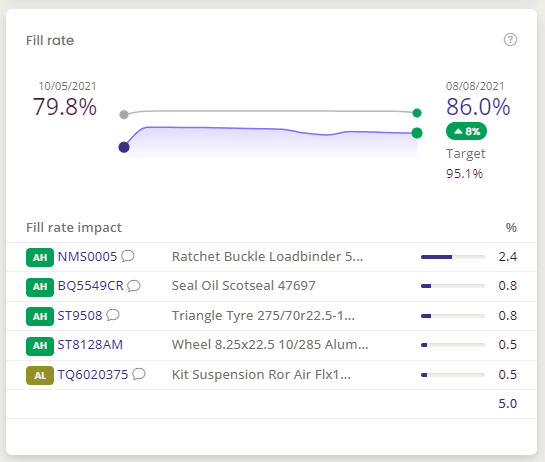
Ultimately, you will want to understand your fill rate targets and track towards them. If you keep getting closer to the target, you know you are going in the right direction. Keep tracking it. You have to know what you want to measure, your target, and how it’s changing over time.
Step 2: Start with the core 5 metrics
If you’re unclear what to measure, start with the core 5 metrics outlined above. By establishing baseline measurements for these five essential inventory performance metrics, you can start to get a clear picture of what’s happening at your business and with your supply chain.
Tip: Don’t try to track everything at once. Focus on these proven indicators first.
Step 3: Set up daily and weekly reviews
- Daily: Monitor fill rate and stock-out alerts
- Weekly: Review forecast accuracy and turnover for high-impact SKUs
- Monthly: Analyze DIO trends and adjust safety stock parameters
In a more stable environment, you can review your inventory KPIs less frequently. When reviewing, ensure that you examine your upstream supply and downstream demand. Frequently review your orders and see if they align with your demand and whether your inventory ordering cycle correlates with the current reality of receiving stock from your suppliers.
The more volatile the supply chain becomes, the more regularly you have to establish, review and measure your inventory KPIs to help organize and plan your inventory accordingly.
Step 4: Use the 80/20 rule for maximum impact
We recommend reviewing the highest-value and the fastest-moving spend more closely to get the best value for your spend.
Another way to look at it is with the 80/20 rule. Focus your attention on the 20% of SKUs that drive 80% of your business value. These items deserve daily monitoring, while other items can be reviewed less frequently.
Why do inventory performance metrics matter?
Inventory performance metrics matter to businesses of all sizes because they allow planners and inventory managers to quickly identify issues, trend changes, and volatility using data. They also improve inventory visibility.
Inventory visibility aims to show all internal records of your inventory, and it’s crucial for your supply chain so you can better stock, monitor, and order relevant items at the necessary time before potential stock-outs occur. Having complete visibility of your inventory holding is a complicated but necessary process.
Entrepreneur states, “Knowing what’s happening in your supply chain is vital, especially during and after market disruptions like these. Having a 360-degree view of the entire supply chain network is of paramount importance. The lack thereof can result in supply chains being disorganized, expensive, and inefficient.”
Keeping the above in mind, supply chain disruptions, like:
- complex customer orders
- a lack of data and insights
- a shortage in shipping containers
- and transportation capacity
can add extra strain to monitoring, tracking, and having complete visibility over your inventory holding. However, if you have the right inventory KPIs in place, you can more quickly adapt to disruptions or even catch them before they occur.
According to Material Handling & Logistics, “With today’s immense challenges due to the COVID-19 pandemic disrupting and debilitating the traditional retail model, plus the extreme volatility in supply and demand experienced by so many omnichannel organizations, the need for an efficient and agile supply chain has become ever more apparent. A not only resilient, but optimized supply chain is imperative to success, directly impacting sales, customer service, brand loyalty, and competitive advantage.”
What are the benefits of setting inventory KPI’s?
The use and selection of inventory KPIs help evaluate operational processes and turn them into financial records.
Selecthub believes, “The purpose of using metrics and KPIs across inventory control systems is to drive the most effective behaviors, decisions and strategies possible. Metrics and KPIs that reinforce the silo-based behavior of many manufacturers (such as data and knowledge hoarding) are being replaced by those that reward collaboration. With valuable metrics and increased collaboration, businesses are able to improve on-time deliveries, increase customer satisfaction and reduce operating costs.”
If you don’t have a demand planning solution and KPIs in place, your inventory value will be inaccurate, and you will experience potential stock-outs with longer lead times, and customers will be unhappy and leave. If you don’t know what will happen in the future, you can’t plan for today and make sure your business will go where you want it to be.
Common mistakes planners make with inventory performance metrics
- Tracking too many metrics at once. Start with the top 5 and master them before adding more
- Not segmenting by ABC classification. A-items need daily attention, C-items can be reviewed weekly
- Ignoring seasonal patterns. Adjust your benchmarks for seasonal businesses
- Focusing only on historical data. Use metrics to predict future performance
- Not taking action on insights. Metrics are only valuable when they drive decisions
Using demand planning tools to improve inventory performance management
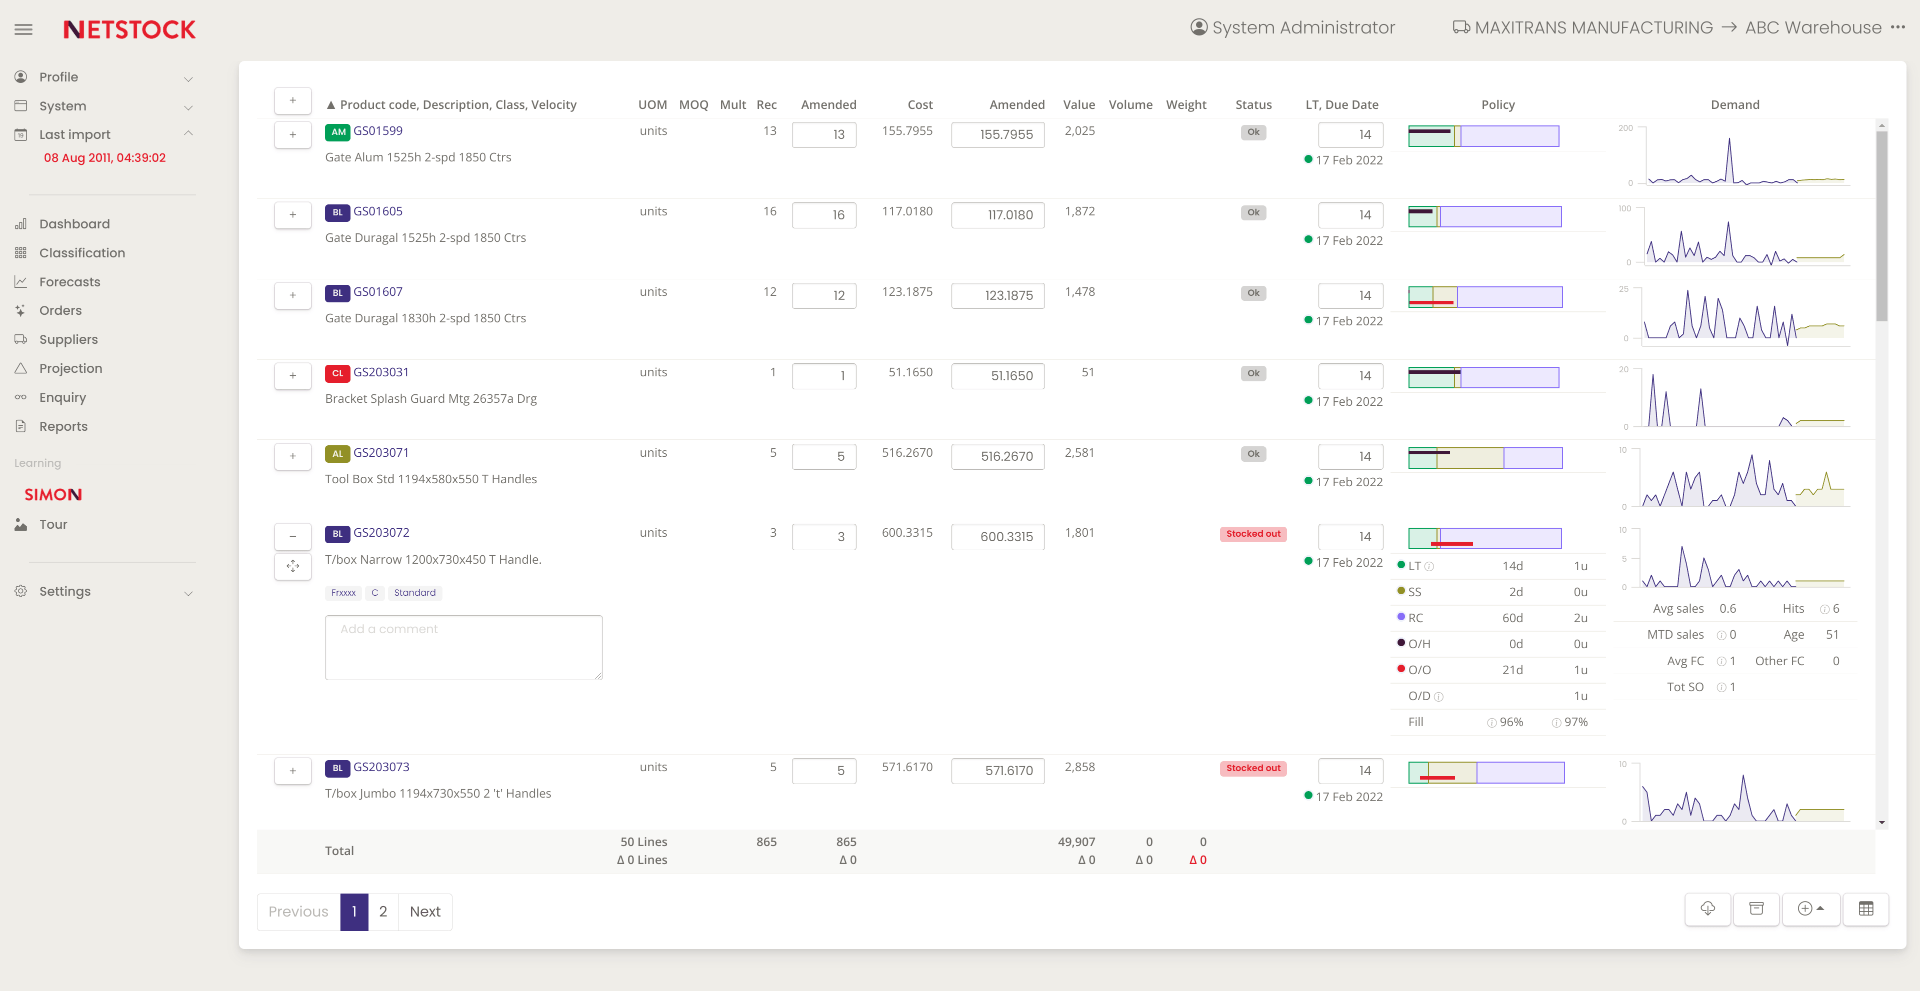
The Netstock Inventory Dashboard allows you to effectively manage what you measure well in your inventory, namely stock holding and fill rate. Focus your attention on the top 5 items that will help you positively impact your inventory.
The key is to work on the 80/20 principle – focus on 20% of the stock items, which will give you 80% of the sales and help you make a massive and intelligent impact on getting your inventory on the right path.

How businesses use Netstock for inventory management
RAM Products, established over 30 years ago, is a privately-owned Maintenance Repair and Operations (MRO) business. The company supplies parts to B2B businesses across the USA and they are a prime example of how using Netstock helps them achieve overall inventory visibility. They trust the data and deliver excellent customer service and support.
“Using Netstock, we merely change our fill rate percentages and reduce those by around 20% per classification. By adhering to the Netstock order recommendations, we saw our inventory come down.” – James Shotts, VP of Operations.