Inventory is easily the largest asset on a product-based business’s balance sheet. Managed well, it facilitates orders and keeps customers coming back. But when managed poorly, inventory can be a liability that drains cash.
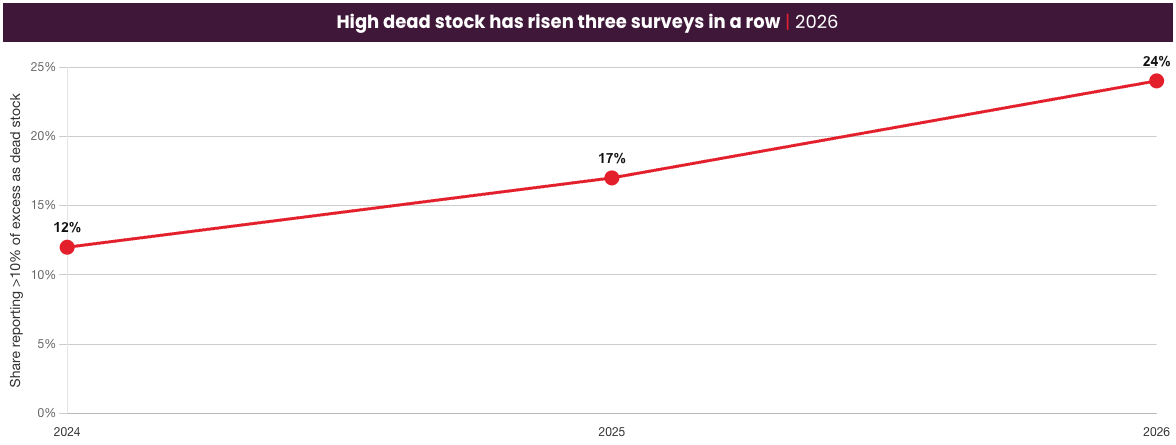
According to Netstock’s Benchmark Report, 24% of SMBs report more than 10% of inventory as dead stock, doubling the 12% rate reported just two years earlier. Every extra unit carries inventory costs that impact multiple line items on the P&L and put your business at risk.
Key takeaways
- Inventory costs stretch well past the supplier invoice. They include the cost of ordering, holding, running short, and stock you can never sell.
- Inbound freight and import duties generally belong in inventory value, while outbound freight and selling costs hit the income statement right away.
- Carrying costs grow every day stock sits unsold, so waiting to act on slow movers makes them more expensive.
- Forecast error and unreliable lead times push teams to hold extra buffer stock, which inflates carrying costs.
- Savings come fastest when you rank SKUs by financial risk and fix the highest-impact items first.
What are inventory costs?
Inventory costs are all the expenses a business incurs to buy, move, store, and manage inventory throughout its lifecycle. Inventory costs extend past the purchase price to include ordering costs, holding costs, shortage costs, and losses on stock you can’t sell.
These costs matter because inventory ties up working capital. Knowing how inventory value is calculated shows you how much of your balance sheet is locked in stock.
What is included in inventory costs?
Purchase and material costs
Purchase cost is the price you pay suppliers for finished goods or the materials and components you build them from. It’s the foundation of inventory valuation, and every other cost layers on top of it.
This category is often tricky because supplier pricing rarely stays flat. Volume discounts and supplier minimum order quantities often push you to buy more than demand requires. A discount only pays off if the savings outweigh the cost of slower inventory turns while the extra units wait to sell.
Freight, duties, and landed costs
Landed cost is the total cost to get inventory into your warehouse and ready to sell. It adds inbound freight, customs duties, tariffs, and insurance in transit to the purchase price. Tariff volatility is a major force facing SMBs today, and it makes this bucket harder to predict.
So, are freight costs included in inventory? Inbound freight generally is. However, outbound freight to customers is a selling cost. It gets expensed when you ship and isn’t included in inventory costs.
Labor and production overhead
Manufacturers add conversion costs on top of materials. These include direct labor and quality inspection on the line. They also include allocated overhead, such as factory utilities and equipment depreciation. These are capitalized inventory costs, meaning they become part of inventory value on the balance sheet. They reach the income statement only when the finished product sells.
Storage and handling
Storage and handling costs cover the physical work of keeping goods. Think warehouse rent or depreciation, utilities, forklifts and racking, and the labor to receive and put away stock. These are part of your inventory management costs, but they’re narrower than carrying costs. Carrying costs, covered next, also include the cost of capital and the risk that stock loses value.
Main types of inventory costs
Planners think in decisions, so it can be helpful to break down different types of inventory costs into categories aligned with planner responsibilities. Each one rises or falls with a different choice you make.
| Cost Type | What It Covers | When It Shows Up |
| Ordering | Purchase orders, receiving, supplier management | Each replenishment cycle |
| Holding/Carrying | Storage, capital, insurance, obsolescence | Ongoing while stock is held |
| Stock-out | Lost sales, backorders, expedited shipping | When demand exceeds supply |
| Obsolescence | Write-downs, disposal, dead stock clearance | End of product lifecycle |
Ordering costs
Among the different types of inventory costs, ordering costs create the clearest trade-off that planners are constantly balancing. Frequent small orders raise ordering costs but keep stock lean. Fewer large orders cut ordering costs but raise what you spend to hold the extra units.
Holding and carrying costs
To calculate inventory holding costs, different sub-costs must be considered.
- Capital cost: The return you give up when cash is tied up in stock.
- Storage cost: Warehouse space, utilities, handling equipment, and labor.
- Service cost: Insurance, taxes, cycle counts, and the systems used to track stock.
- Risk cost: Losses from obsolescence, shrinkage, damage, and spoilage.
Stock-out and shortage costs
Stock-out costs hit when you can’t meet demand from available inventory. You lose the sale or create a backorder, often paying expedited freight to recover. Repeated misses can send customers to a competitor for good.
Lost sales are revenue you never booked, so they rarely appear on the income statement. In Netstock’s 2026 benchmark data, top-performing “stars” lost sales worth only 2.7% of inventory value in 2026, while “stragglers” lost 15.0%.
Obsolescence and dead stock costs
Dead stock is inventory you can’t sell at normal margins, for example because it has stopped moving. It costs you twice: once through write-downs and disposal, and again through the warehouse space it takes up.
Netstock’s 2026 Supply Chain Benchmark Report found that while SMBs across the globe are working to reduce excess inventory more quickly, dead stock rates are rising.
What this contradiction highlights is notable: SMBs aren’t necessarily holding too much inventory. They’re simply holding the wrong inventory. This mismatch between inventory management and demand forecasting puts added pressure on businesses as dead stock piles build and inventory costs add up.
Source: 2026 Netstock Supply Chain Planning Benchmark Report
Examples of inventory costs across a product business
These examples of inventory costs show how the same categories appear in the SMB models Netstock works with most.
DistributorAn importer buying from overseas suppliers sees inventory costs like these:
- Ocean freight and customs duties on each inbound container.
- Lease payments on the warehouse that holds the stock.
- Capital tied up in safety stock that covers long supplier lead times.
- Air freight to rush in a key item that ran out early.
ManufacturerA manufacturer carries inventory costs at every stage of production:
- Raw material purchases, often in bulk to meet supplier minimums.
- Labor and overhead absorbed into work in progress (WIP), meaning partly finished goods.
- Storage for finished goods waiting to ship.
- Scrap and rework when a production run goes wrong.
RetailerA retailer’s inventory costs center on the shelf and the stockroom:
- Wholesale purchase price on each item.
- Backroom space that limits how much product a store can hold.
- Markdowns needed to clear slow movers.
- Shrinkage from theft and damage.
Capitalized inventory costs versus expensed costs in accounting
Inventory costs accounting comes down to one question: does the cost go on the balance sheet or straight to the income statement? Capitalized inventory costs are added to inventory value and become the cost of goods sold (COGS) only when the item sells. Period costs are expensed when you incur them.
| Capitalized (added to inventory value) | Expensed (period cost) |
| Purchase price | Selling costs |
| Inbound freight | Outbound freight |
| Import duties | General administrative |
| Direct labor (manufacturing) | Abnormal waste |
| Production overhead | Storage after production complete (in some cases) |
When capitalized costs swing, gross margin moves with them, and planners often react by cutting or padding orders. Those reactions can travel upstream through the bullwhip effect, where small demand changes grow into large order swings at each tier of the supply chain.
How to calculate total inventory costs
Total inventory cost adds four components together. Planning decisions move the last three the most.
- Purchase cost: Units bought × landed cost per unit.
- Total ordering costs: Number of orders × cost per order.
- Total carrying costs: Average inventory value × your carrying cost rate.
- Stock-out costs: Lost margin from unfilled demand, plus any expedite fees.
Most businesses estimate carrying costs as a percentage of average inventory value. Build your rate from your own capital, storage, insurance, and risk costs.
Accurate numbers depend on your ERP data, though lost sales often need estimating from backorders and cancelled lines. Match these figures to your inventory costs accounting records so finance and operations share one total.
Example of inventory cost calculation
Here’s an illustrative example using hypothetical figures. A distributor places 200 purchase orders a year at $50 each, so ordering costs total $10,000. Its average inventory value multiplied by its carrying cost rate comes to an assumed $90,000.
It also misses 500 units of demand at $30 of lost margin each, a $15,000 stock-out cost. Excluding purchase cost, the controllable total is $115,000. Carrying costs are nine times ordering costs, so cutting order frequency would target the wrong cost.
Why inventory costs rise faster than expected
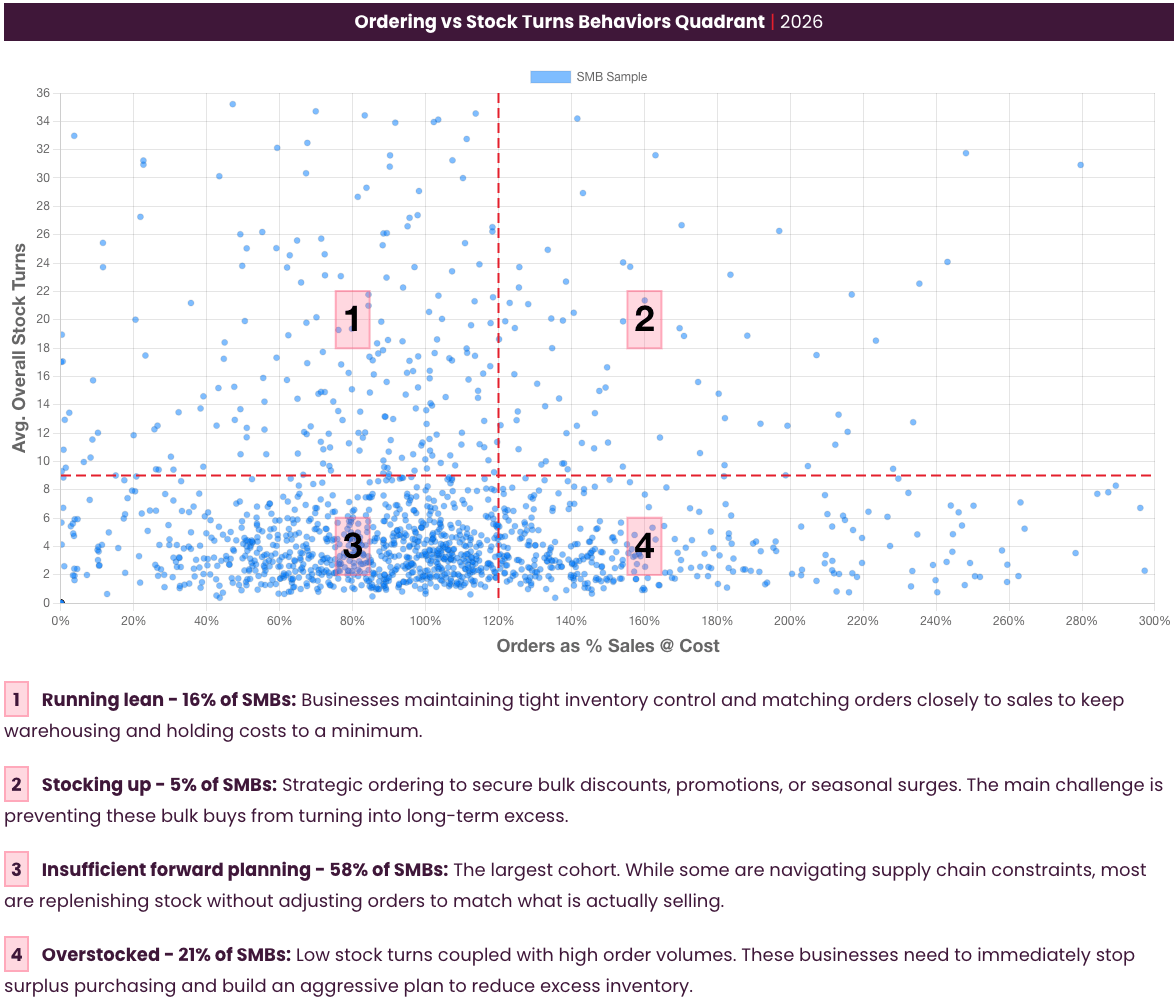
While days inventory outstanding (DIO) is often an early warning sign for rising inventory costs, most cost overruns trace back to planning habits and limited visibility. Netstock’s 2026 benchmark data places 58% of SMBs in its “insufficient forward planning” group, the largest cohort. That gap can show up as inventory management costs that grow faster than sales.
Source: 2026 Netstock Supply Chain Planning Benchmark Report
Inaccurate demand forecasts
Forecast error pushes costs in two directions. Over-forecast and you buy stock that sits, adding carrying costs. Under-forecast and you run short, paying in lost sales and expedited freight. Forecast accuracy also sets your total inventory investment. The less you trust the forecast, the more safety stock you hold to protect against it.
Weak replenishment discipline
Replenishment breaks down when reorder points are inconsistent or out of date. Buyers fall back on reactive ordering from spreadsheets. The result is over-ordering on some items and emergency buys with premium freight on others.
According to Netstock’s 2026 benchmark data, most SMBs in that planning group are replenishing stock without adjusting orders to match what is actually selling. When order rules stay fixed while demand moves, costs drift up unnoticed.
Excess and obsolete stock buildup
Slow-moving stock builds when nobody reviews it. The cost compounds because carrying costs keep running every month while the stock’s resale value falls. By the time an item gets flagged, the write-down can exceed the margin it was meant to earn.
Supplier and lead time variability
Lead time is the time between placing an order and receiving it. When suppliers deliver late or inconsistently, planners hold more safety stock to cover the gap, which raises carrying costs across the range.
This is the most common pressure point for SMBs. Netstock’s 2026 benchmark data shows lead-time variability affects 74% of SMBs, while long lead times affect 63% and MOQs 60%.
“When lead times swing, planners tend to pad every item with the same extra weeks of stock,” says Barry Kukkuk, CTO and Co-founder at Netstock. “One of the easiest solutions for this? Setting safety stock by each SKU’s real supply risk puts buffer where it protects service. Everywhere else, it just adds cost.”
Additionally, SMBs can take steps to help reduce long lead times. This two-pronged approach, dynamically setting safety stock while addressing supplier reliability issues directly, is an effective way to lower inventory costs across the board.
Learn more: Tips to reduce long lead times
How to reduce and lower inventory costs
To reduce inventory costs, start from an accurate baseline. Confirm your beginning inventory figure so you can measure real change over the period. Then work through these five steps in order.
1. Improve forecast accuracy at the SKU level
Better forecasts reduce inventory costs from both sides, cutting excess and preventing stock-outs. Forecast at the item-location level, meaning each SKU at each warehouse or store. Aggregate forecasts hide the fact that one site is overstocked while another runs short.
Automated demand forecasting tools can test several statistical models per item and pick the best fit. Spreadsheets struggle to do that across thousands of SKUs.
2. Set data-driven reorder points and safety stock
Successful inventory ordering primarily relies on two things: the reorder point and safety stock. A reorder point is the stock level that triggers a new order. Base it on actual demand variability and supplier lead time, and you’ll stop over-ordering items that move slowly.
Safety stock needs the same treatment. Review it regularly instead of applying one static rule to every item. Dynamic buffers lower inventory costs because each SKU holds only what its risk requires.
3. Rebalance inventory across locations
Excess in one warehouse and shortages in another is a hidden cost. Review stock distribution across locations on a set schedule.
In Netstock’s 2026 benchmark data, redistribution is used by only about a third of SMBs (34%), still well behind promotions. Purpose-built software makes this effective method to reduce inventory costs easier by matching surplus at one site to demand at another.
It even works at scale. Race Winning Brands redistributed excess inventory worth nearly 400,000 euros across the US, Canada and Europe with Netstock’s Excess Redistribution.
4. Clear excess and obsolete stock
Identify slow movers early and clear them through discounts, returns to vendor, bundles, or liquidation.
However, before you clear anything, be sure to calculate disposable excess. That’s the stock above what you’ll need over the supplier lead time, after accounting for open purchase orders. Clearing only that amount frees cash without creating new stock-outs.
5. Use ERP data to prioritize the highest-impact SKUs
Not every SKU deserves equal attention. ABC analysis ranks items by value, with A items driving the largest share of revenue or spend. Start your cost work there, then layer in sales velocity so fast movers get tighter reviews.
The challenge for most SMBs is visibility because the ERP holds transactions without flagging what needs action today. Netstock calculates supply and forecast risk daily for every SKU and location. It turns raw ERP data into a ranked list of items with the highest financial impact.
How inventory management software keeps costs under control
Manual planning is a type of inventory cost in its own right. Spreadsheet hours delay action on emerging opportunities, and slow decisions let excess and shortages grow.
Software changes that in four ways:
- Automated demand forecasting replaces spreadsheet guesswork with statistical models, so buy quantities track real demand.
- Real-time visibility shows stock across every location at once, which makes rebalancing practical.
- Exception-based alerts flag the items that need attention, so planners stop scanning thousands of rows.
- Replenishment recommendations calculate order quantities from demand and lead time.
Platforms like Netstock integrate with ERP systems to turn transactional data into those recommendations. Results can be significant. In a 2022 case study, Best Vinyl cut its inventory from $2.7 million to $1.4 million in under two years while maintaining high customer service levels.
Turn inventory cost visibility into released working capital
Understanding your inventory costs is the first step. The payoff comes when you take action. Cleared excess returns as cash and avoided stock-outs protect your margin.