
Balancing inventory investment with service levels
When your warehouse manager reports that a critical component is out of stock just as a major customer’s order needs to ship, the resulting scramble impacts your entire operation. Beyond the lost sale, there are damaged customer relationships, rushed expediting fees, and a ripple effect on your supply chain team’s workload.
For many manufacturing, retail, and wholesale distribution businesses, this scenario plays out regularly—tying up working capital in the wrong inventory while still experiencing stockouts of crucial items. The solution? A strategic approach to safety stock.
In this guide, we’ll show you how to calculate and implement adequate safety stock levels that protect your business without unnecessarily tying up capital.
Table of contents:
What is safety stock (and why it matters to your bottom line)
Safety stock is the buffer inventory you maintain beyond expected demand to protect against variability in both supply and demand. Unlike arbitrary “just-in-case” inventory, properly calculated safety stock is a strategic asset that:
- Protects your business from unpredictable supply chain disruptions
- Maintains service levels during unexpected demand spikes
- Optimizes working capital by applying protection selectively where it matters most
Safety stock formulas: Choosing the right approach
Standard deviation method (for service level targeting)
Safety Stock = (Z-score x Standard Deviation of Demand during Lead Time) + Average Demand during Lead Time
- Z = service level factor (e.g., 1.28 for 90% service level)
- σ = standard deviation of demand
- LT = lead time in days
When to use this formula: When maintaining specific service level targets is your priority, and you have reliable historical data to calculate demand variation.
Practical example:A manufacturing facility supplies automotive components with these parameters:
- Desired service level: 90% (Z = 1.28)
- Standard deviation of daily demand: 15 units
- Supplier lead time: 10 days
Safety Stock = 1.28 × 15 × √10 ≈ 61 units
By maintaining 61 units as safety stock, the facility ensures they can meet unexpected demand spikes 90% of the time while avoiding the capital drain of excessive inventory.
Periodic review model (for scheduled inventory reviews)
Periodic review model: Safety stock = (Z * σd * √(T + L))
- Z = service level factor
- σd = standard deviation of demand during review period
- T = review period (in days)
- L = lead time (in days)
When to use this formula: When your inventory management process includes scheduled weekly or monthly review cycles rather than continuous monitoring. This formula helps assess the degree of demand fluctuation during the review period, the duration of the review process, and the lead time required to replenish stock.
Practical example:A retail business reviews its inventory every 7 days with these parameters:
- Desired service level: 95% (Z = 1.65)
- Standard deviation of weekly demand: 25 units
- Supplier lead time: 14 days
Safety Stock = 1.65 × 25 × √(7 + 14) ≈ 165 units
For businesses with weekly ordering cycles, this formula accounts for the additional variability during both the review period and lead time.
Economic Order Quantity (EOQ) with safety stock
While safety stock answers “how much buffer inventory to keep,” Economic Order Quantity addresses “how much to order each time.” Combining these approaches creates a comprehensive inventory optimization strategy.
The EOQ formula is:
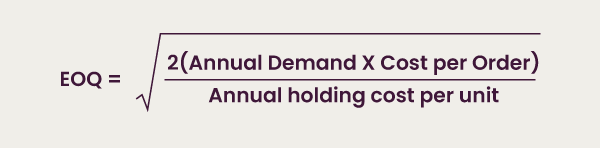
Where:
- D = annual demand quantity
- S = cost per order
- H = annual holding cost per unit
When to use this approach: When you want to minimize total inventory costs by balancing ordering costs against holding costs, while still maintaining protection against variability.
Practical example:A wholesale distributor has these parameters for a popular product:
- Annual demand: 5,000 units
- Cost per order: $150 (administrative costs, shipping, etc.)
- Annual holding cost: $15 per unit (20% of $75 unit cost)
EOQ = √(2 × 5,000 × 150 ÷ 15) ≈ 316 units
By ordering 316 units per order (rather than weekly small orders or quarterly large orders), the distributor minimizes total inventory costs. When combined with an appropriate safety stock calculation, this approach ensures both cost efficiency and protection against stockouts.
The integrated approach works particularly well for businesses with stable baseline demand but occasional variability, allowing them to optimize the regular ordering cycle while maintaining protection against unexpected scenarios.
Implementing safety stock in your business: A step-by-step approach
If you’re calculating safety stock manually (without dedicated inventory optimization software), follow these practical steps:
- Segment your inventory using ABC analysis:
- A items (highest value/volume): Apply highest service levels (95-98%)
- B items (moderate value/volume): Apply moderate service levels (85-95%)
- C items (lowest value/volume): Apply basic service levels (80-85%)
- Assess supplier reliability for each major vendor:
- Review on-time delivery percentage from the past 6-12 months
- Calculate average lead time deviation (actual vs. promised)
- Categorize suppliers from “Excellent” to “Very Bad” based on these metrics
- Measure forecast accuracy by product group:
- Calculate Mean Absolute Percentage Error (MAPE) for each product category
- Assign reliability factors (higher factors for less predictable products)
- Create a dynamic safety stock calculation that considers:
- Product classification (A/B/C importance)
- Supplier reliability factor
- Forecast reliability factor
- Lead time
- Implement and monitor the results:
- Track fill rates before and after implementation
- Measure inventory value changes
- Adjust factors based on performance
Watch how Netstock optimizes your inventory

Common scenarios where safety stock saves your business
1. When suppliers miss promised delivery dates
Scenario: Your critical component supplier promises delivery in 7 days, but consistently delivers in 9-12 days despite regular follow-ups.
Without safety stock: Production lines stop, customer orders are delayed, and your supply chain team spends excessive time expediting and managing customer expectations.
With strategic safety stock: Operations continue smoothly during the 2-5 day supplier delay, staff focuses on value-adding activities rather than crisis management, and customer commitments are met consistently.
2. When suppliers deliver incomplete orders
Scenario: Your garden supply store ordered 100 premium water pots for a key customer’s upcoming event, but your supplier delivers only 50 units due to production constraints.
Without safety stock: You can fulfill only half the customer’s requirements, damaging your relationship and potentially losing future business to competitors.
With strategic safety stock: You can complete the order from safety stock while working with your supplier on the remainder, maintaining customer trust and your reputation for reliability.
3. When demand unexpectedly surges
Scenario: A social media influencer features one of your products, causing a 300% spike in orders practically overnight.
Without safety stock: You quickly stockout, disappoint potential new customers, and miss the opportunity to capitalize on the viral moment.
With strategic safety stock: You can fulfill the initial surge while expediting replenishment, capturing new customers and revenue during the critical exposure period.
Best practices for safety stock management
Dynamic adjustments are essential
One of the most common inventory management mistakes is treating safety stock as a “set-and-forget” number. Your business environment is constantly changing, and your safety stock levels should adjust accordingly.
Not all products deserve safety stock
Safety stock represents invested capital. Apply it strategically by:
- Maintaining higher safety stock for A-class items with consistent demand
- Reducing or eliminating safety stock for obsolete or extremely slow-moving items
- Adjusting safety stock seasonally for products with predictable demand patterns
Case study: Quality Foods implemented Netstock’s automated safety stock calculations based on item classifications, allowing them to “focus on their revenue spinners and not waste time on the slow movers,” resulting in both improved availability of key products and reduced overall inventory investment.
Measure the business impact
The true value of safety stock isn’t just avoiding stockouts—it’s the comprehensive business impact:
- Reduced expedited shipping costs
- Decreased time spent on shortage management
- Improved customer retention rates
- Enhanced supply chain team productivity
- Optimized working capital deployment
Taking the next step: Beyond manual calculations
While the formulas and methods outlined above provide a solid foundation, most businesses with more than a few hundred SKUs quickly find that manual safety stock calculations become unwieldy and difficult to maintain.
Modern inventory optimization solutions like Netstock automatically:
- Calculate optimal safety stock by item
- Adjust for seasonality and trends
- Account for supplier reliability
- Recommend inventory policy changes
- Track performance and suggest improvements
Maintaining an optimal safety stock level is crucial for small to medium-sized businesses (SMBs). Insufficient safety stock can harm your business, while excessive safety stock can tie up capital and increase carrying costs. Adopting the right safety stock formula for your business is crucial, yet it’s a complex process with numerous variables that must be considered. Investing in an inventory management solution will help to automatically ensure you order the right amount of safety stock for the right products to meet demand!